Immigrants vs Native/Alaskan Disability Age 5 to 17
COMPARE
Immigrants
Native/Alaskan
Disability Age 5 to 17
Disability Age 5 to 17 Comparison
Immigrants
Natives/Alaskans
5.4%
DISABILITY AGE 5 TO 17
97.0/ 100
METRIC RATING
120th/ 347
METRIC RANK
6.3%
DISABILITY AGE 5 TO 17
0.0/ 100
METRIC RATING
305th/ 347
METRIC RANK
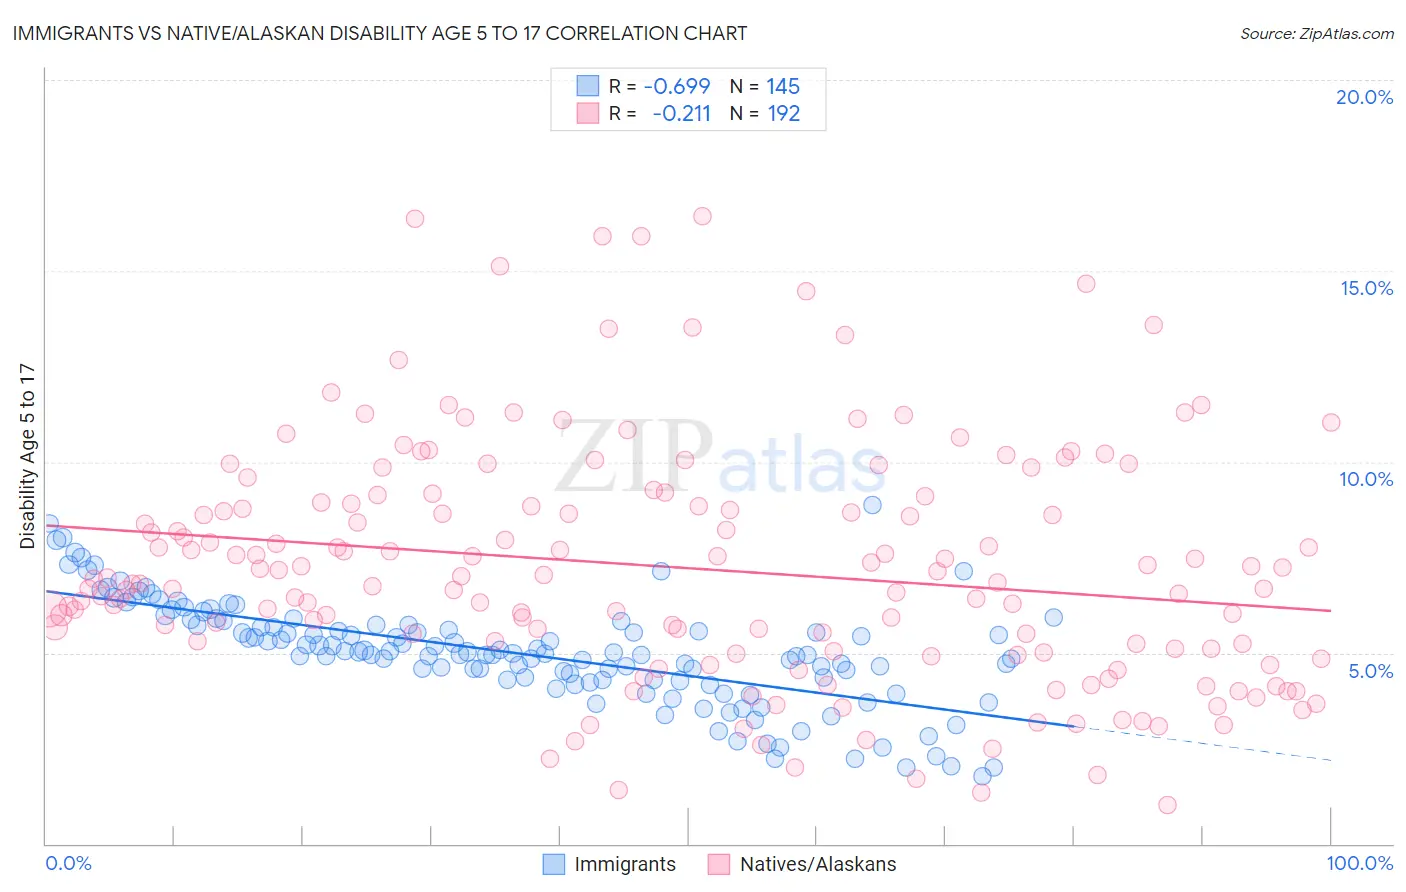
Immigrants vs Native/Alaskan Disability Age 5 to 17 Correlation Chart
The statistical analysis conducted on geographies consisting of 563,154,251 people shows a significant negative correlation between the proportion of Immigrants and percentage of population with a disability between the ages 5 and 17 in the United States with a correlation coefficient (R) of -0.699 and weighted average of 5.4%. Similarly, the statistical analysis conducted on geographies consisting of 506,009,662 people shows a weak negative correlation between the proportion of Natives/Alaskans and percentage of population with a disability between the ages 5 and 17 in the United States with a correlation coefficient (R) of -0.211 and weighted average of 6.3%, a difference of 17.6%.
Disability Age 5 to 17 Correlation Summary
| Measurement | Immigrants | Native/Alaskan |
| Minimum | 1.8% | 1.0% |
| Maximum | 8.9% | 16.4% |
| Range | 7.1% | 15.4% |
| Mean | 5.0% | 7.2% |
| Median | 5.0% | 6.9% |
| Interquartile 25% (IQ1) | 4.3% | 5.1% |
| Interquartile 75% (IQ3) | 5.7% | 8.9% |
| Interquartile Range (IQR) | 1.4% | 3.8% |
| Standard Deviation (Sample) | 1.4% | 3.1% |
| Standard Deviation (Population) | 1.4% | 3.1% |
Similar Demographics by Disability Age 5 to 17
Demographics Similar to Immigrants by Disability Age 5 to 17
In terms of disability age 5 to 17, the demographic groups most similar to Immigrants are Immigrants from South America (5.4%, a difference of 0.050%), South American (5.4%, a difference of 0.060%), Immigrants from Afghanistan (5.3%, a difference of 0.17%), Cypriot (5.3%, a difference of 0.33%), and Maltese (5.4%, a difference of 0.38%).
| Demographics | Rating | Rank | Disability Age 5 to 17 |
| Aleuts | 97.8 /100 | #113 | Exceptional 5.3% |
| Immigrants | Northern Europe | 97.8 /100 | #114 | Exceptional 5.3% |
| Cubans | 97.8 /100 | #115 | Exceptional 5.3% |
| Cypriots | 97.7 /100 | #116 | Exceptional 5.3% |
| Immigrants | Afghanistan | 97.4 /100 | #117 | Exceptional 5.3% |
| South Americans | 97.1 /100 | #118 | Exceptional 5.4% |
| Immigrants | South America | 97.1 /100 | #119 | Exceptional 5.4% |
| Immigrants | Immigrants | 97.0 /100 | #120 | Exceptional 5.4% |
| Maltese | 96.0 /100 | #121 | Exceptional 5.4% |
| Chileans | 95.8 /100 | #122 | Exceptional 5.4% |
| Immigrants | Ethiopia | 95.5 /100 | #123 | Exceptional 5.4% |
| Crow | 95.0 /100 | #124 | Exceptional 5.4% |
| Immigrants | Chile | 95.0 /100 | #125 | Exceptional 5.4% |
| New Zealanders | 95.0 /100 | #126 | Exceptional 5.4% |
| Latvians | 95.0 /100 | #127 | Exceptional 5.4% |
Demographics Similar to Natives/Alaskans by Disability Age 5 to 17
In terms of disability age 5 to 17, the demographic groups most similar to Natives/Alaskans are Nonimmigrants (6.3%, a difference of 0.10%), Senegalese (6.3%, a difference of 0.14%), Yakama (6.3%, a difference of 0.22%), Bahamian (6.3%, a difference of 0.24%), and Celtic (6.3%, a difference of 0.33%).
| Demographics | Rating | Rank | Disability Age 5 to 17 |
| Lumbee | 0.0 /100 | #298 | Tragic 6.2% |
| Welsh | 0.0 /100 | #299 | Tragic 6.3% |
| Carpatho Rusyns | 0.0 /100 | #300 | Tragic 6.3% |
| U.S. Virgin Islanders | 0.0 /100 | #301 | Tragic 6.3% |
| Celtics | 0.0 /100 | #302 | Tragic 6.3% |
| Yakama | 0.0 /100 | #303 | Tragic 6.3% |
| Senegalese | 0.0 /100 | #304 | Tragic 6.3% |
| Natives/Alaskans | 0.0 /100 | #305 | Tragic 6.3% |
| Immigrants | Nonimmigrants | 0.0 /100 | #306 | Tragic 6.3% |
| Bahamians | 0.0 /100 | #307 | Tragic 6.3% |
| Scotch-Irish | 0.0 /100 | #308 | Tragic 6.3% |
| Hmong | 0.0 /100 | #309 | Tragic 6.3% |
| Alaskan Athabascans | 0.0 /100 | #310 | Tragic 6.3% |
| Immigrants | Dominica | 0.0 /100 | #311 | Tragic 6.3% |
| Bermudans | 0.0 /100 | #312 | Tragic 6.4% |