Immigrants from Jamaica vs Native/Alaskan Disability Age 5 to 17
COMPARE
Immigrants from Jamaica
Native/Alaskan
Disability Age 5 to 17
Disability Age 5 to 17 Comparison
Immigrants from Jamaica
Natives/Alaskans
6.1%
DISABILITY AGE 5 TO 17
0.1/ 100
METRIC RATING
279th/ 347
METRIC RANK
6.3%
DISABILITY AGE 5 TO 17
0.0/ 100
METRIC RATING
305th/ 347
METRIC RANK
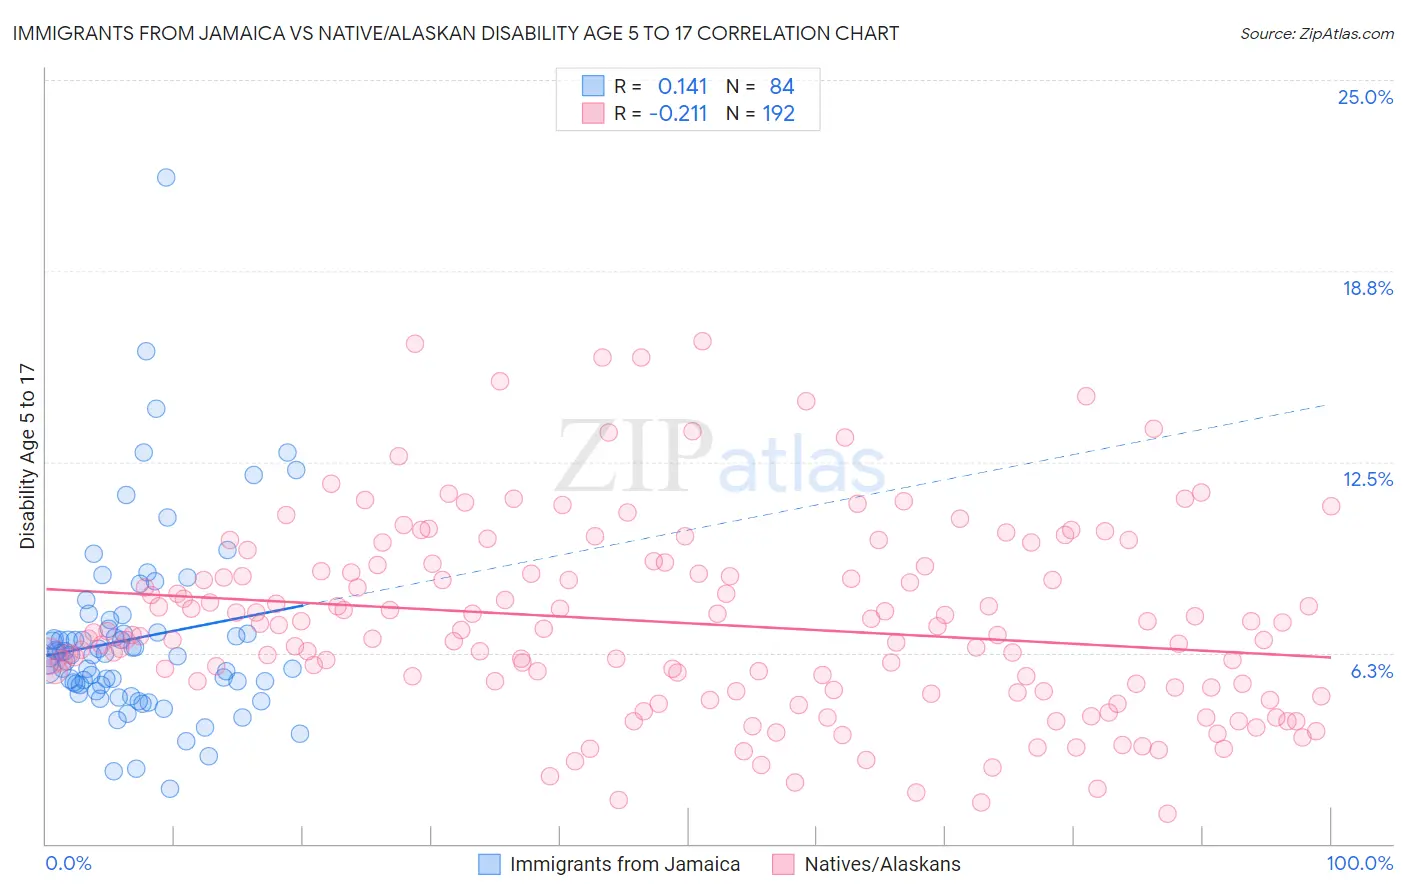
Immigrants from Jamaica vs Native/Alaskan Disability Age 5 to 17 Correlation Chart
The statistical analysis conducted on geographies consisting of 299,987,065 people shows a poor positive correlation between the proportion of Immigrants from Jamaica and percentage of population with a disability between the ages 5 and 17 in the United States with a correlation coefficient (R) of 0.141 and weighted average of 6.1%. Similarly, the statistical analysis conducted on geographies consisting of 506,009,662 people shows a weak negative correlation between the proportion of Natives/Alaskans and percentage of population with a disability between the ages 5 and 17 in the United States with a correlation coefficient (R) of -0.211 and weighted average of 6.3%, a difference of 3.2%.
Disability Age 5 to 17 Correlation Summary
| Measurement | Immigrants from Jamaica | Native/Alaskan |
| Minimum | 1.8% | 1.0% |
| Maximum | 21.8% | 16.4% |
| Range | 20.0% | 15.4% |
| Mean | 6.7% | 7.2% |
| Median | 6.2% | 6.9% |
| Interquartile 25% (IQ1) | 5.2% | 5.1% |
| Interquartile 75% (IQ3) | 7.0% | 8.9% |
| Interquartile Range (IQR) | 1.8% | 3.8% |
| Standard Deviation (Sample) | 3.1% | 3.1% |
| Standard Deviation (Population) | 3.0% | 3.1% |
Similar Demographics by Disability Age 5 to 17
Demographics Similar to Immigrants from Jamaica by Disability Age 5 to 17
In terms of disability age 5 to 17, the demographic groups most similar to Immigrants from Jamaica are Immigrants from Liberia (6.1%, a difference of 0.14%), Portuguese (6.1%, a difference of 0.14%), Puget Sound Salish (6.1%, a difference of 0.22%), Scottish (6.1%, a difference of 0.39%), and German (6.1%, a difference of 0.64%).
| Demographics | Rating | Rank | Disability Age 5 to 17 |
| Finns | 0.2 /100 | #272 | Tragic 6.0% |
| Alaska Natives | 0.2 /100 | #273 | Tragic 6.0% |
| Cheyenne | 0.2 /100 | #274 | Tragic 6.0% |
| Dutch | 0.2 /100 | #275 | Tragic 6.0% |
| Japanese | 0.1 /100 | #276 | Tragic 6.1% |
| Puget Sound Salish | 0.1 /100 | #277 | Tragic 6.1% |
| Immigrants | Liberia | 0.1 /100 | #278 | Tragic 6.1% |
| Immigrants | Jamaica | 0.1 /100 | #279 | Tragic 6.1% |
| Portuguese | 0.1 /100 | #280 | Tragic 6.1% |
| Scottish | 0.0 /100 | #281 | Tragic 6.1% |
| Germans | 0.0 /100 | #282 | Tragic 6.1% |
| Ugandans | 0.0 /100 | #283 | Tragic 6.2% |
| Sub-Saharan Africans | 0.0 /100 | #284 | Tragic 6.2% |
| English | 0.0 /100 | #285 | Tragic 6.2% |
| Colville | 0.0 /100 | #286 | Tragic 6.2% |
Demographics Similar to Natives/Alaskans by Disability Age 5 to 17
In terms of disability age 5 to 17, the demographic groups most similar to Natives/Alaskans are Nonimmigrants (6.3%, a difference of 0.10%), Senegalese (6.3%, a difference of 0.14%), Yakama (6.3%, a difference of 0.22%), Bahamian (6.3%, a difference of 0.24%), and Celtic (6.3%, a difference of 0.33%).
| Demographics | Rating | Rank | Disability Age 5 to 17 |
| Lumbee | 0.0 /100 | #298 | Tragic 6.2% |
| Welsh | 0.0 /100 | #299 | Tragic 6.3% |
| Carpatho Rusyns | 0.0 /100 | #300 | Tragic 6.3% |
| U.S. Virgin Islanders | 0.0 /100 | #301 | Tragic 6.3% |
| Celtics | 0.0 /100 | #302 | Tragic 6.3% |
| Yakama | 0.0 /100 | #303 | Tragic 6.3% |
| Senegalese | 0.0 /100 | #304 | Tragic 6.3% |
| Natives/Alaskans | 0.0 /100 | #305 | Tragic 6.3% |
| Immigrants | Nonimmigrants | 0.0 /100 | #306 | Tragic 6.3% |
| Bahamians | 0.0 /100 | #307 | Tragic 6.3% |
| Scotch-Irish | 0.0 /100 | #308 | Tragic 6.3% |
| Hmong | 0.0 /100 | #309 | Tragic 6.3% |
| Alaskan Athabascans | 0.0 /100 | #310 | Tragic 6.3% |
| Immigrants | Dominica | 0.0 /100 | #311 | Tragic 6.3% |
| Bermudans | 0.0 /100 | #312 | Tragic 6.4% |