Immigrants from Romania vs Thai Unemployment
COMPARE
Immigrants from Romania
Thai
Unemployment
Unemployment Comparison
Immigrants from Romania
Thais
5.0%
UNEMPLOYMENT
93.7/ 100
METRIC RATING
106th/ 347
METRIC RANK
4.7%
UNEMPLOYMENT
99.9/ 100
METRIC RATING
22nd/ 347
METRIC RANK
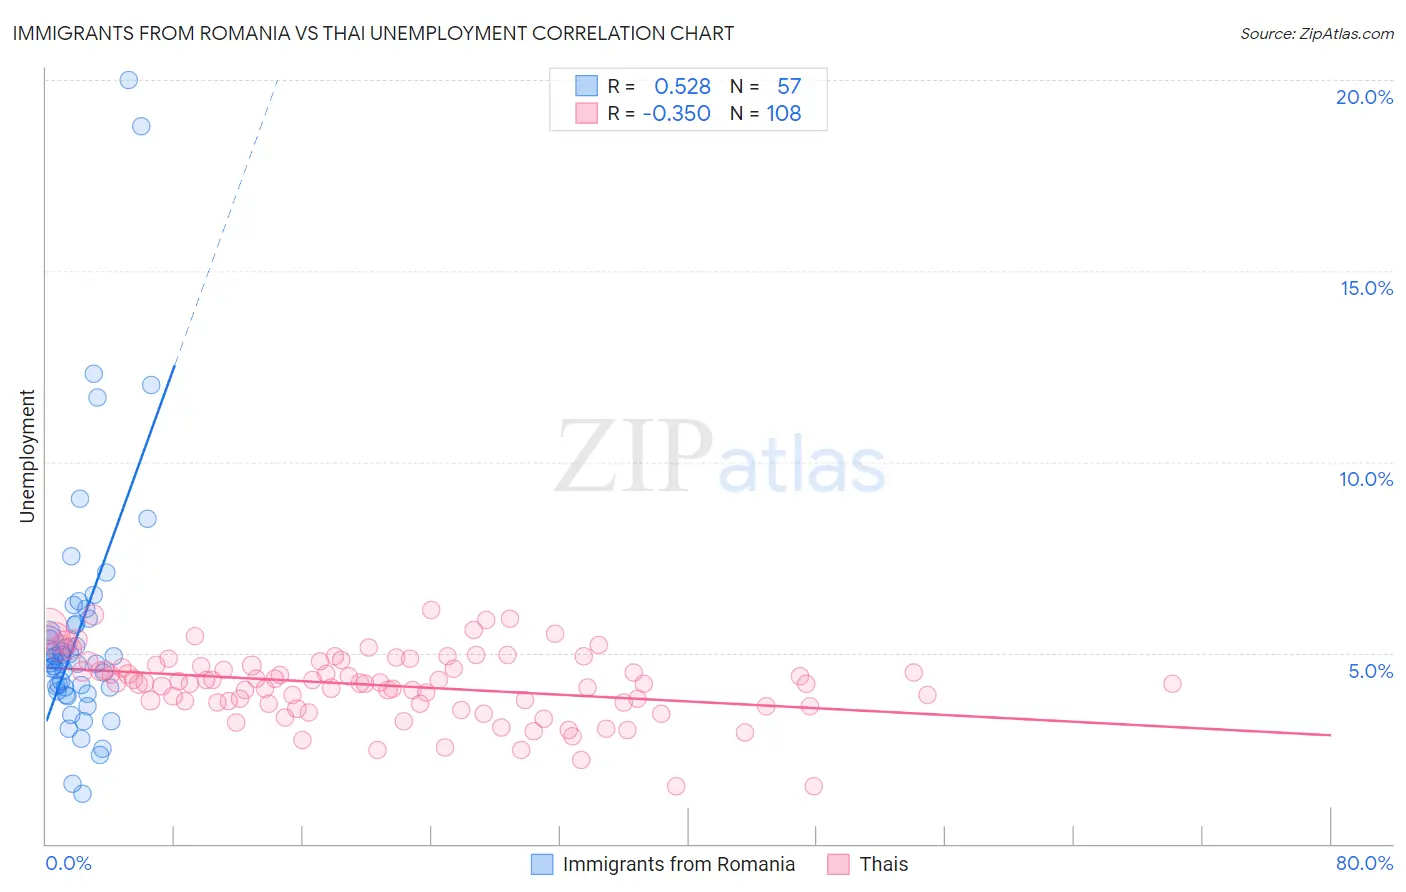
Immigrants from Romania vs Thai Unemployment Correlation Chart
The statistical analysis conducted on geographies consisting of 256,924,519 people shows a substantial positive correlation between the proportion of Immigrants from Romania and unemployment in the United States with a correlation coefficient (R) of 0.528 and weighted average of 5.0%. Similarly, the statistical analysis conducted on geographies consisting of 475,133,267 people shows a mild negative correlation between the proportion of Thais and unemployment in the United States with a correlation coefficient (R) of -0.350 and weighted average of 4.7%, a difference of 7.4%.
Unemployment Correlation Summary
| Measurement | Immigrants from Romania | Thai |
| Minimum | 1.3% | 1.5% |
| Maximum | 20.0% | 6.1% |
| Range | 18.7% | 4.6% |
| Mean | 5.6% | 4.2% |
| Median | 4.8% | 4.2% |
| Interquartile 25% (IQ1) | 4.0% | 3.7% |
| Interquartile 75% (IQ3) | 5.8% | 4.7% |
| Interquartile Range (IQR) | 1.8% | 0.99% |
| Standard Deviation (Sample) | 3.4% | 0.89% |
| Standard Deviation (Population) | 3.4% | 0.88% |
Similar Demographics by Unemployment
Demographics Similar to Immigrants from Romania by Unemployment
In terms of unemployment, the demographic groups most similar to Immigrants from Romania are Immigrants from Turkey (5.0%, a difference of 0.010%), Immigrants from Kuwait (5.0%, a difference of 0.020%), Chickasaw (5.0%, a difference of 0.070%), Osage (5.0%, a difference of 0.070%), and Maltese (5.0%, a difference of 0.070%).
| Demographics | Rating | Rank | Unemployment |
| Mongolians | 94.8 /100 | #99 | Exceptional 5.0% |
| Estonians | 94.6 /100 | #100 | Exceptional 5.0% |
| Americans | 94.3 /100 | #101 | Exceptional 5.0% |
| Immigrants | Argentina | 94.1 /100 | #102 | Exceptional 5.0% |
| Chickasaw | 94.0 /100 | #103 | Exceptional 5.0% |
| Osage | 94.0 /100 | #104 | Exceptional 5.0% |
| Maltese | 94.0 /100 | #105 | Exceptional 5.0% |
| Immigrants | Romania | 93.7 /100 | #106 | Exceptional 5.0% |
| Immigrants | Turkey | 93.7 /100 | #107 | Exceptional 5.0% |
| Immigrants | Kuwait | 93.7 /100 | #108 | Exceptional 5.0% |
| Immigrants | Eritrea | 93.3 /100 | #109 | Exceptional 5.0% |
| Immigrants | Lithuania | 93.2 /100 | #110 | Exceptional 5.0% |
| Chileans | 93.2 /100 | #111 | Exceptional 5.0% |
| South Africans | 92.6 /100 | #112 | Exceptional 5.1% |
| Argentineans | 92.4 /100 | #113 | Exceptional 5.1% |
Demographics Similar to Thais by Unemployment
In terms of unemployment, the demographic groups most similar to Thais are Welsh (4.7%, a difference of 0.0%), Carpatho Rusyn (4.7%, a difference of 0.020%), British (4.7%, a difference of 0.30%), Venezuelan (4.7%, a difference of 0.38%), and Latvian (4.7%, a difference of 0.45%).
| Demographics | Rating | Rank | Unemployment |
| Europeans | 99.9 /100 | #15 | Exceptional 4.6% |
| Chinese | 99.9 /100 | #16 | Exceptional 4.7% |
| Slovenes | 99.9 /100 | #17 | Exceptional 4.7% |
| Immigrants | Venezuela | 99.9 /100 | #18 | Exceptional 4.7% |
| Scottish | 99.9 /100 | #19 | Exceptional 4.7% |
| Carpatho Rusyns | 99.9 /100 | #20 | Exceptional 4.7% |
| Welsh | 99.9 /100 | #21 | Exceptional 4.7% |
| Thais | 99.9 /100 | #22 | Exceptional 4.7% |
| British | 99.9 /100 | #23 | Exceptional 4.7% |
| Venezuelans | 99.9 /100 | #24 | Exceptional 4.7% |
| Latvians | 99.9 /100 | #25 | Exceptional 4.7% |
| Bulgarians | 99.9 /100 | #26 | Exceptional 4.7% |
| Finns | 99.9 /100 | #27 | Exceptional 4.7% |
| Cubans | 99.8 /100 | #28 | Exceptional 4.7% |
| Poles | 99.8 /100 | #29 | Exceptional 4.7% |