Immigrants from Romania vs Thai Hearing Disability
COMPARE
Immigrants from Romania
Thai
Hearing Disability
Hearing Disability Comparison
Immigrants from Romania
Thais
3.0%
HEARING DISABILITY
48.4/ 100
METRIC RATING
175th/ 347
METRIC RANK
2.5%
HEARING DISABILITY
99.8/ 100
METRIC RATING
19th/ 347
METRIC RANK
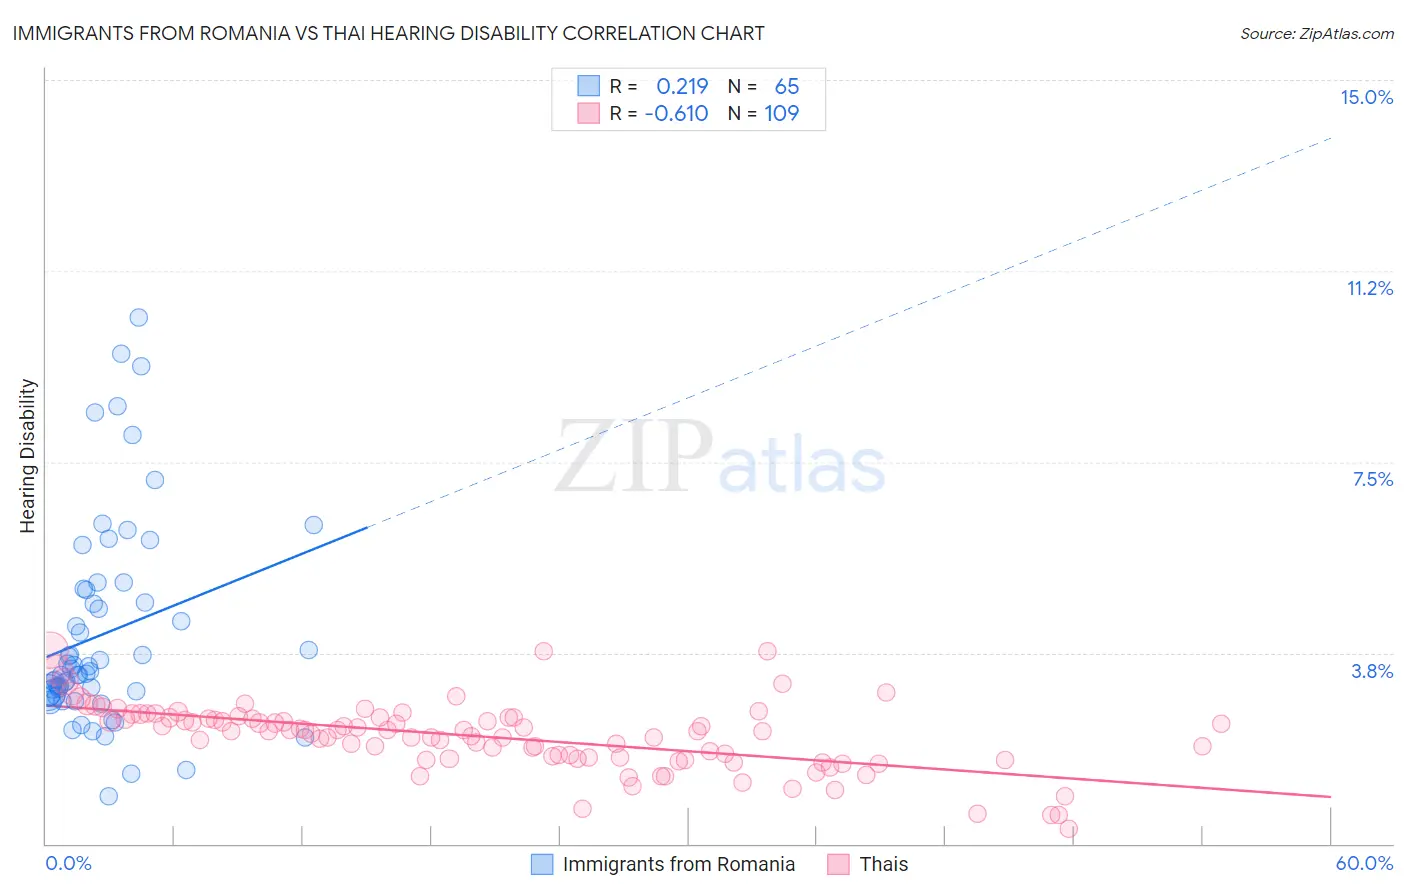
Immigrants from Romania vs Thai Hearing Disability Correlation Chart
The statistical analysis conducted on geographies consisting of 256,976,190 people shows a weak positive correlation between the proportion of Immigrants from Romania and percentage of population with hearing disability in the United States with a correlation coefficient (R) of 0.219 and weighted average of 3.0%. Similarly, the statistical analysis conducted on geographies consisting of 475,566,624 people shows a significant negative correlation between the proportion of Thais and percentage of population with hearing disability in the United States with a correlation coefficient (R) of -0.610 and weighted average of 2.5%, a difference of 17.8%.
Hearing Disability Correlation Summary
| Measurement | Immigrants from Romania | Thai |
| Minimum | 0.93% | 0.30% |
| Maximum | 10.3% | 3.8% |
| Range | 9.4% | 3.5% |
| Mean | 4.1% | 2.1% |
| Median | 3.4% | 2.2% |
| Interquartile 25% (IQ1) | 2.9% | 1.7% |
| Interquartile 75% (IQ3) | 5.0% | 2.5% |
| Interquartile Range (IQR) | 2.1% | 0.79% |
| Standard Deviation (Sample) | 2.0% | 0.65% |
| Standard Deviation (Population) | 2.0% | 0.65% |
Similar Demographics by Hearing Disability
Demographics Similar to Immigrants from Romania by Hearing Disability
In terms of hearing disability, the demographic groups most similar to Immigrants from Romania are Panamanian (3.0%, a difference of 0.14%), Indonesian (3.0%, a difference of 0.15%), Immigrants from Philippines (3.0%, a difference of 0.20%), Japanese (3.0%, a difference of 0.23%), and Immigrants from Serbia (3.0%, a difference of 0.25%).
| Demographics | Rating | Rank | Hearing Disability |
| Immigrants | Greece | 57.9 /100 | #168 | Average 3.0% |
| Arabs | 57.6 /100 | #169 | Average 3.0% |
| Immigrants | Cabo Verde | 56.9 /100 | #170 | Average 3.0% |
| Immigrants | Ukraine | 56.6 /100 | #171 | Average 3.0% |
| Armenians | 56.0 /100 | #172 | Average 3.0% |
| Immigrants | Serbia | 51.1 /100 | #173 | Average 3.0% |
| Indonesians | 50.0 /100 | #174 | Average 3.0% |
| Immigrants | Romania | 48.4 /100 | #175 | Average 3.0% |
| Panamanians | 47.0 /100 | #176 | Average 3.0% |
| Immigrants | Philippines | 46.4 /100 | #177 | Average 3.0% |
| Japanese | 46.0 /100 | #178 | Average 3.0% |
| Immigrants | Moldova | 43.1 /100 | #179 | Average 3.0% |
| Immigrants | Sweden | 42.4 /100 | #180 | Average 3.0% |
| Immigrants | Belgium | 41.5 /100 | #181 | Average 3.0% |
| Immigrants | Italy | 41.1 /100 | #182 | Average 3.0% |
Demographics Similar to Thais by Hearing Disability
In terms of hearing disability, the demographic groups most similar to Thais are Dominican (2.5%, a difference of 0.030%), Immigrants from Bolivia (2.5%, a difference of 0.050%), Ghanaian (2.5%, a difference of 0.11%), Immigrants from Sierra Leone (2.6%, a difference of 0.16%), and Immigrants from Nigeria (2.6%, a difference of 0.65%).
| Demographics | Rating | Rank | Hearing Disability |
| Trinidadians and Tobagonians | 99.9 /100 | #12 | Exceptional 2.5% |
| Sierra Leoneans | 99.9 /100 | #13 | Exceptional 2.5% |
| Ecuadorians | 99.9 /100 | #14 | Exceptional 2.5% |
| Barbadians | 99.9 /100 | #15 | Exceptional 2.5% |
| Immigrants | West Indies | 99.9 /100 | #16 | Exceptional 2.5% |
| Immigrants | India | 99.9 /100 | #17 | Exceptional 2.5% |
| Dominicans | 99.8 /100 | #18 | Exceptional 2.5% |
| Thais | 99.8 /100 | #19 | Exceptional 2.5% |
| Immigrants | Bolivia | 99.8 /100 | #20 | Exceptional 2.5% |
| Ghanaians | 99.8 /100 | #21 | Exceptional 2.5% |
| Immigrants | Sierra Leone | 99.8 /100 | #22 | Exceptional 2.6% |
| Immigrants | Nigeria | 99.8 /100 | #23 | Exceptional 2.6% |
| Immigrants | Ghana | 99.8 /100 | #24 | Exceptional 2.6% |
| Immigrants | El Salvador | 99.7 /100 | #25 | Exceptional 2.6% |
| Immigrants | Senegal | 99.7 /100 | #26 | Exceptional 2.6% |