Immigrants from Portugal vs Australian Disability
COMPARE
Immigrants from Portugal
Australian
Disability
Disability Comparison
Immigrants from Portugal
Australians
12.9%
DISABILITY
0.0/ 100
METRIC RATING
281st/ 347
METRIC RANK
11.5%
DISABILITY
82.5/ 100
METRIC RATING
144th/ 347
METRIC RANK
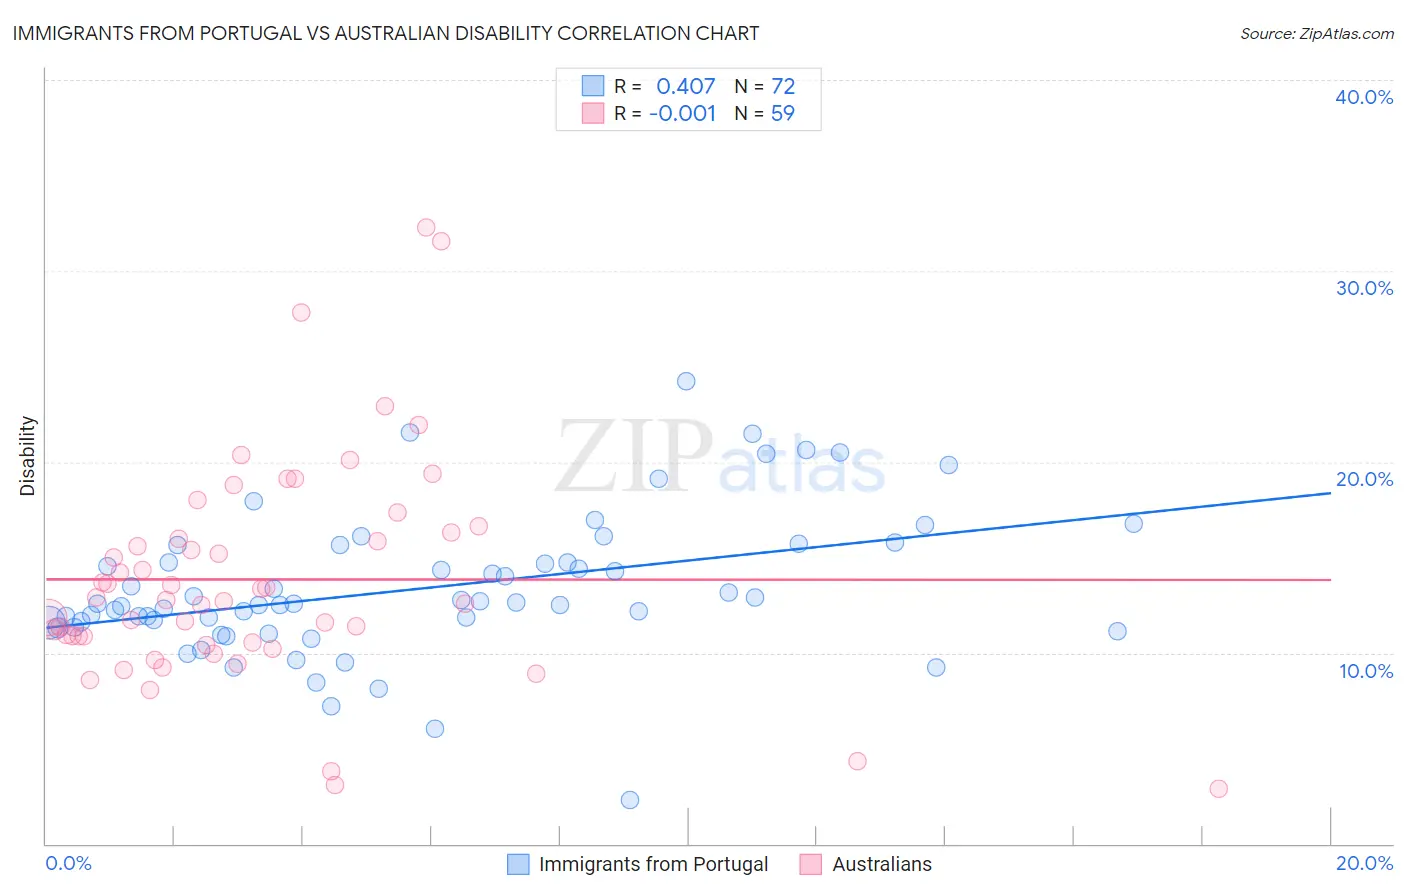
Immigrants from Portugal vs Australian Disability Correlation Chart
The statistical analysis conducted on geographies consisting of 174,786,483 people shows a moderate positive correlation between the proportion of Immigrants from Portugal and percentage of population with a disability in the United States with a correlation coefficient (R) of 0.407 and weighted average of 12.9%. Similarly, the statistical analysis conducted on geographies consisting of 224,142,596 people shows no correlation between the proportion of Australians and percentage of population with a disability in the United States with a correlation coefficient (R) of -0.001 and weighted average of 11.5%, a difference of 11.8%.
Disability Correlation Summary
| Measurement | Immigrants from Portugal | Australian |
| Minimum | 2.3% | 2.9% |
| Maximum | 24.2% | 32.3% |
| Range | 21.9% | 29.3% |
| Mean | 13.4% | 13.8% |
| Median | 12.6% | 12.8% |
| Interquartile 25% (IQ1) | 11.4% | 10.6% |
| Interquartile 75% (IQ3) | 15.2% | 16.3% |
| Interquartile Range (IQR) | 3.7% | 5.7% |
| Standard Deviation (Sample) | 3.8% | 5.8% |
| Standard Deviation (Population) | 3.7% | 5.8% |
Similar Demographics by Disability
Demographics Similar to Immigrants from Portugal by Disability
In terms of disability, the demographic groups most similar to Immigrants from Portugal are Spanish (12.8%, a difference of 0.14%), Scottish (12.9%, a difference of 0.14%), Irish (12.9%, a difference of 0.16%), Fijian (12.8%, a difference of 0.19%), and German (12.8%, a difference of 0.29%).
| Demographics | Rating | Rank | Disability |
| Nepalese | 0.0 /100 | #274 | Tragic 12.8% |
| Sioux | 0.0 /100 | #275 | Tragic 12.8% |
| Hmong | 0.0 /100 | #276 | Tragic 12.8% |
| Dutch | 0.0 /100 | #277 | Tragic 12.8% |
| Germans | 0.0 /100 | #278 | Tragic 12.8% |
| Fijians | 0.0 /100 | #279 | Tragic 12.8% |
| Spanish | 0.0 /100 | #280 | Tragic 12.8% |
| Immigrants | Portugal | 0.0 /100 | #281 | Tragic 12.9% |
| Scottish | 0.0 /100 | #282 | Tragic 12.9% |
| Irish | 0.0 /100 | #283 | Tragic 12.9% |
| Welsh | 0.0 /100 | #284 | Tragic 12.9% |
| Crow | 0.0 /100 | #285 | Tragic 12.9% |
| English | 0.0 /100 | #286 | Tragic 13.0% |
| Africans | 0.0 /100 | #287 | Tragic 13.0% |
| Whites/Caucasians | 0.0 /100 | #288 | Tragic 13.0% |
Demographics Similar to Australians by Disability
In terms of disability, the demographic groups most similar to Australians are Moroccan (11.5%, a difference of 0.070%), Nigerian (11.5%, a difference of 0.090%), Immigrants from Sudan (11.5%, a difference of 0.24%), Immigrants from Hungary (11.5%, a difference of 0.25%), and Immigrants from Grenada (11.5%, a difference of 0.31%).
| Demographics | Rating | Rank | Disability |
| Kenyans | 87.1 /100 | #137 | Excellent 11.5% |
| New Zealanders | 87.0 /100 | #138 | Excellent 11.5% |
| Ghanaians | 87.0 /100 | #139 | Excellent 11.5% |
| Russians | 86.8 /100 | #140 | Excellent 11.5% |
| Immigrants | Grenada | 86.1 /100 | #141 | Excellent 11.5% |
| Immigrants | Sudan | 85.3 /100 | #142 | Excellent 11.5% |
| Moroccans | 83.3 /100 | #143 | Excellent 11.5% |
| Australians | 82.5 /100 | #144 | Excellent 11.5% |
| Nigerians | 81.3 /100 | #145 | Excellent 11.5% |
| Immigrants | Hungary | 79.0 /100 | #146 | Good 11.5% |
| Immigrants | Ukraine | 77.6 /100 | #147 | Good 11.5% |
| Sudanese | 77.1 /100 | #148 | Good 11.5% |
| Immigrants | Norway | 73.2 /100 | #149 | Good 11.6% |
| Romanians | 72.7 /100 | #150 | Good 11.6% |
| Immigrants | Kenya | 72.1 /100 | #151 | Good 11.6% |