Immigrants from Portugal vs Immigrants from Thailand Disability
COMPARE
Immigrants from Portugal
Immigrants from Thailand
Disability
Disability Comparison
Immigrants from Portugal
Immigrants from Thailand
12.9%
DISABILITY
0.0/ 100
METRIC RATING
281st/ 347
METRIC RANK
12.0%
DISABILITY
9.3/ 100
METRIC RATING
207th/ 347
METRIC RANK
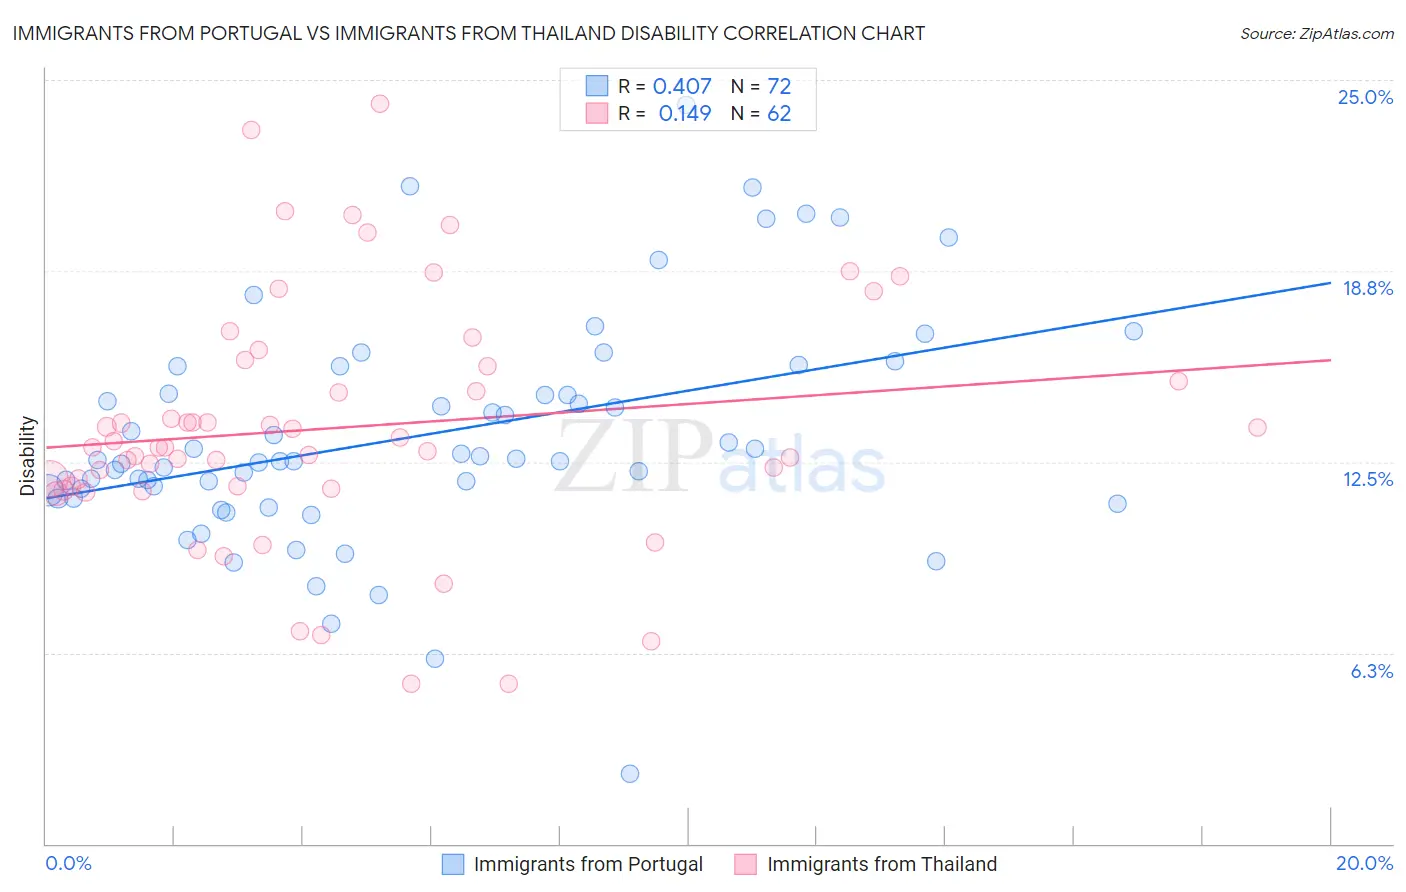
Immigrants from Portugal vs Immigrants from Thailand Disability Correlation Chart
The statistical analysis conducted on geographies consisting of 174,786,483 people shows a moderate positive correlation between the proportion of Immigrants from Portugal and percentage of population with a disability in the United States with a correlation coefficient (R) of 0.407 and weighted average of 12.9%. Similarly, the statistical analysis conducted on geographies consisting of 316,986,616 people shows a poor positive correlation between the proportion of Immigrants from Thailand and percentage of population with a disability in the United States with a correlation coefficient (R) of 0.149 and weighted average of 12.0%, a difference of 7.2%.
Disability Correlation Summary
| Measurement | Immigrants from Portugal | Immigrants from Thailand |
| Minimum | 2.3% | 5.2% |
| Maximum | 24.2% | 24.2% |
| Range | 21.9% | 19.0% |
| Mean | 13.4% | 13.6% |
| Median | 12.6% | 13.0% |
| Interquartile 25% (IQ1) | 11.4% | 11.7% |
| Interquartile 75% (IQ3) | 15.2% | 15.6% |
| Interquartile Range (IQR) | 3.7% | 4.0% |
| Standard Deviation (Sample) | 3.8% | 4.0% |
| Standard Deviation (Population) | 3.7% | 3.9% |
Similar Demographics by Disability
Demographics Similar to Immigrants from Portugal by Disability
In terms of disability, the demographic groups most similar to Immigrants from Portugal are Spanish (12.8%, a difference of 0.14%), Scottish (12.9%, a difference of 0.14%), Irish (12.9%, a difference of 0.16%), Fijian (12.8%, a difference of 0.19%), and German (12.8%, a difference of 0.29%).
| Demographics | Rating | Rank | Disability |
| Nepalese | 0.0 /100 | #274 | Tragic 12.8% |
| Sioux | 0.0 /100 | #275 | Tragic 12.8% |
| Hmong | 0.0 /100 | #276 | Tragic 12.8% |
| Dutch | 0.0 /100 | #277 | Tragic 12.8% |
| Germans | 0.0 /100 | #278 | Tragic 12.8% |
| Fijians | 0.0 /100 | #279 | Tragic 12.8% |
| Spanish | 0.0 /100 | #280 | Tragic 12.8% |
| Immigrants | Portugal | 0.0 /100 | #281 | Tragic 12.9% |
| Scottish | 0.0 /100 | #282 | Tragic 12.9% |
| Irish | 0.0 /100 | #283 | Tragic 12.9% |
| Welsh | 0.0 /100 | #284 | Tragic 12.9% |
| Crow | 0.0 /100 | #285 | Tragic 12.9% |
| English | 0.0 /100 | #286 | Tragic 13.0% |
| Africans | 0.0 /100 | #287 | Tragic 13.0% |
| Whites/Caucasians | 0.0 /100 | #288 | Tragic 13.0% |
Demographics Similar to Immigrants from Thailand by Disability
In terms of disability, the demographic groups most similar to Immigrants from Thailand are Immigrants from Senegal (12.0%, a difference of 0.010%), Immigrants from Caribbean (12.0%, a difference of 0.020%), Danish (12.0%, a difference of 0.070%), Immigrants from Western Europe (12.0%, a difference of 0.10%), and Czech (12.0%, a difference of 0.19%).
| Demographics | Rating | Rank | Disability |
| Belizeans | 12.8 /100 | #200 | Poor 11.9% |
| Assyrians/Chaldeans/Syriacs | 12.6 /100 | #201 | Poor 11.9% |
| Immigrants | England | 12.0 /100 | #202 | Poor 12.0% |
| British West Indians | 11.5 /100 | #203 | Poor 12.0% |
| Mexican American Indians | 11.4 /100 | #204 | Poor 12.0% |
| Immigrants | Western Europe | 10.1 /100 | #205 | Poor 12.0% |
| Immigrants | Senegal | 9.4 /100 | #206 | Tragic 12.0% |
| Immigrants | Thailand | 9.3 /100 | #207 | Tragic 12.0% |
| Immigrants | Caribbean | 9.1 /100 | #208 | Tragic 12.0% |
| Danes | 8.7 /100 | #209 | Tragic 12.0% |
| Czechs | 7.9 /100 | #210 | Tragic 12.0% |
| Immigrants | Cambodia | 7.3 /100 | #211 | Tragic 12.0% |
| Austrians | 7.2 /100 | #212 | Tragic 12.0% |
| Immigrants | Iraq | 7.1 /100 | #213 | Tragic 12.0% |
| Immigrants | Somalia | 6.8 /100 | #214 | Tragic 12.0% |