Sri Lankan vs Australian Disability
COMPARE
Sri Lankan
Australian
Disability
Disability Comparison
Sri Lankans
Australians
11.0%
DISABILITY
99.5/ 100
METRIC RATING
69th/ 347
METRIC RANK
11.5%
DISABILITY
82.5/ 100
METRIC RATING
144th/ 347
METRIC RANK
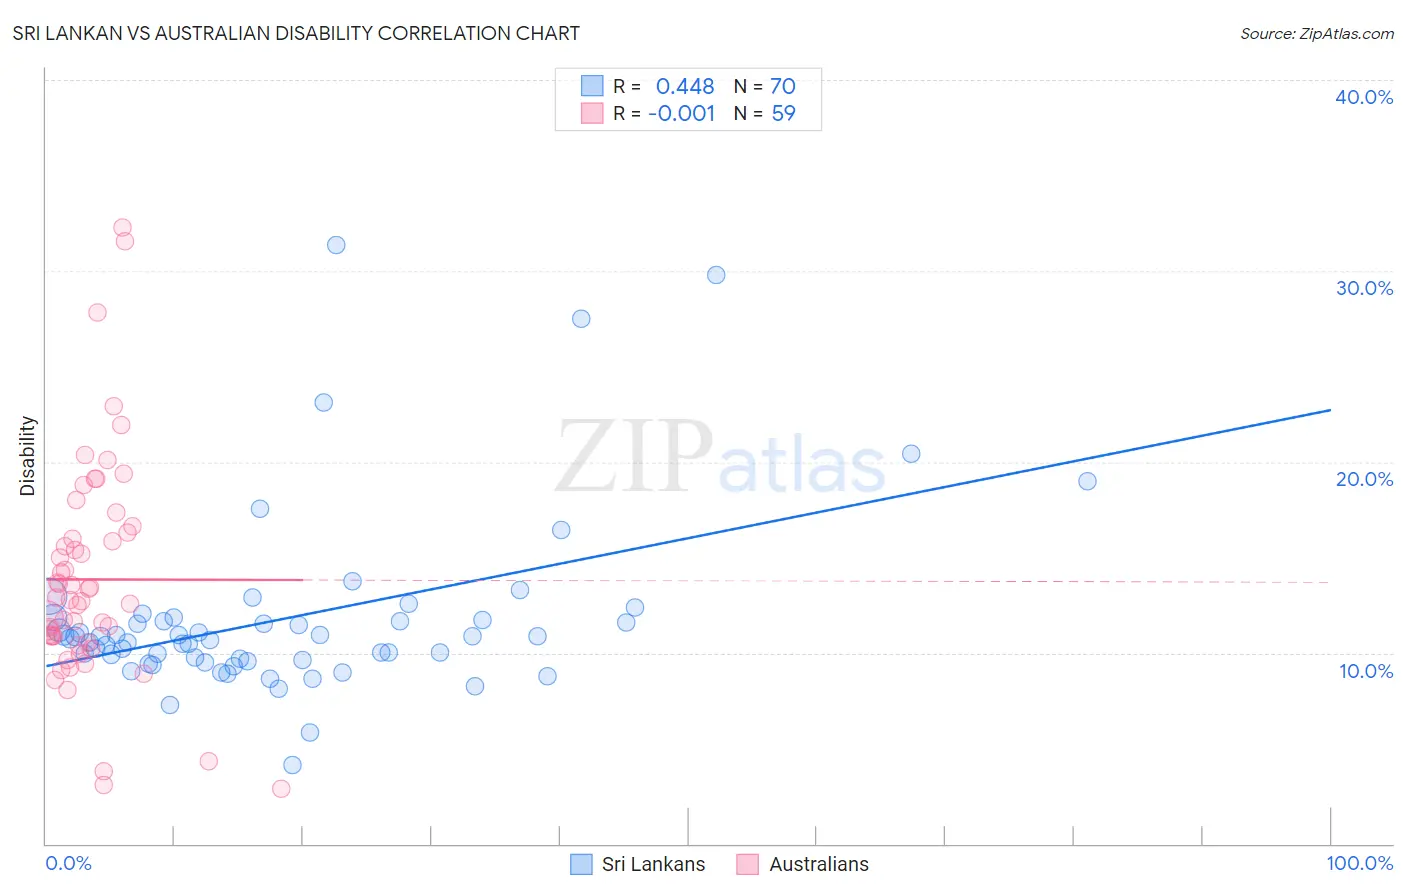
Sri Lankan vs Australian Disability Correlation Chart
The statistical analysis conducted on geographies consisting of 440,510,650 people shows a moderate positive correlation between the proportion of Sri Lankans and percentage of population with a disability in the United States with a correlation coefficient (R) of 0.448 and weighted average of 11.0%. Similarly, the statistical analysis conducted on geographies consisting of 224,142,596 people shows no correlation between the proportion of Australians and percentage of population with a disability in the United States with a correlation coefficient (R) of -0.001 and weighted average of 11.5%, a difference of 4.3%.
Disability Correlation Summary
| Measurement | Sri Lankan | Australian |
| Minimum | 4.1% | 2.9% |
| Maximum | 31.3% | 32.3% |
| Range | 27.2% | 29.3% |
| Mean | 11.8% | 13.8% |
| Median | 10.8% | 12.8% |
| Interquartile 25% (IQ1) | 9.6% | 10.6% |
| Interquartile 75% (IQ3) | 11.7% | 16.3% |
| Interquartile Range (IQR) | 2.1% | 5.7% |
| Standard Deviation (Sample) | 4.8% | 5.8% |
| Standard Deviation (Population) | 4.7% | 5.8% |
Similar Demographics by Disability
Demographics Similar to Sri Lankans by Disability
In terms of disability, the demographic groups most similar to Sri Lankans are Immigrants from France (11.0%, a difference of 0.080%), Immigrants from Lebanon (11.0%, a difference of 0.090%), Immigrants from Chile (11.0%, a difference of 0.18%), Immigrants from Afghanistan (11.0%, a difference of 0.21%), and Immigrants from Bangladesh (11.0%, a difference of 0.21%).
| Demographics | Rating | Rank | Disability |
| Immigrants | Northern Africa | 99.7 /100 | #62 | Exceptional 10.9% |
| Immigrants | Eritrea | 99.7 /100 | #63 | Exceptional 11.0% |
| Immigrants | Sweden | 99.6 /100 | #64 | Exceptional 11.0% |
| Bulgarians | 99.6 /100 | #65 | Exceptional 11.0% |
| Laotians | 99.6 /100 | #66 | Exceptional 11.0% |
| Colombians | 99.6 /100 | #67 | Exceptional 11.0% |
| Immigrants | Afghanistan | 99.6 /100 | #68 | Exceptional 11.0% |
| Sri Lankans | 99.5 /100 | #69 | Exceptional 11.0% |
| Immigrants | France | 99.4 /100 | #70 | Exceptional 11.0% |
| Immigrants | Lebanon | 99.4 /100 | #71 | Exceptional 11.0% |
| Immigrants | Chile | 99.4 /100 | #72 | Exceptional 11.0% |
| Immigrants | Bangladesh | 99.4 /100 | #73 | Exceptional 11.0% |
| Immigrants | Serbia | 99.4 /100 | #74 | Exceptional 11.0% |
| Immigrants | Vietnam | 99.4 /100 | #75 | Exceptional 11.0% |
| Sierra Leoneans | 99.3 /100 | #76 | Exceptional 11.0% |
Demographics Similar to Australians by Disability
In terms of disability, the demographic groups most similar to Australians are Moroccan (11.5%, a difference of 0.070%), Nigerian (11.5%, a difference of 0.090%), Immigrants from Sudan (11.5%, a difference of 0.24%), Immigrants from Hungary (11.5%, a difference of 0.25%), and Immigrants from Grenada (11.5%, a difference of 0.31%).
| Demographics | Rating | Rank | Disability |
| Kenyans | 87.1 /100 | #137 | Excellent 11.5% |
| New Zealanders | 87.0 /100 | #138 | Excellent 11.5% |
| Ghanaians | 87.0 /100 | #139 | Excellent 11.5% |
| Russians | 86.8 /100 | #140 | Excellent 11.5% |
| Immigrants | Grenada | 86.1 /100 | #141 | Excellent 11.5% |
| Immigrants | Sudan | 85.3 /100 | #142 | Excellent 11.5% |
| Moroccans | 83.3 /100 | #143 | Excellent 11.5% |
| Australians | 82.5 /100 | #144 | Excellent 11.5% |
| Nigerians | 81.3 /100 | #145 | Excellent 11.5% |
| Immigrants | Hungary | 79.0 /100 | #146 | Good 11.5% |
| Immigrants | Ukraine | 77.6 /100 | #147 | Good 11.5% |
| Sudanese | 77.1 /100 | #148 | Good 11.5% |
| Immigrants | Norway | 73.2 /100 | #149 | Good 11.6% |
| Romanians | 72.7 /100 | #150 | Good 11.6% |
| Immigrants | Kenya | 72.1 /100 | #151 | Good 11.6% |