Spanish American Indian vs Australian Disability
COMPARE
Spanish American Indian
Australian
Disability
Disability Comparison
Spanish American Indians
Australians
12.1%
DISABILITY
4.1/ 100
METRIC RATING
222nd/ 347
METRIC RANK
11.5%
DISABILITY
82.5/ 100
METRIC RATING
144th/ 347
METRIC RANK
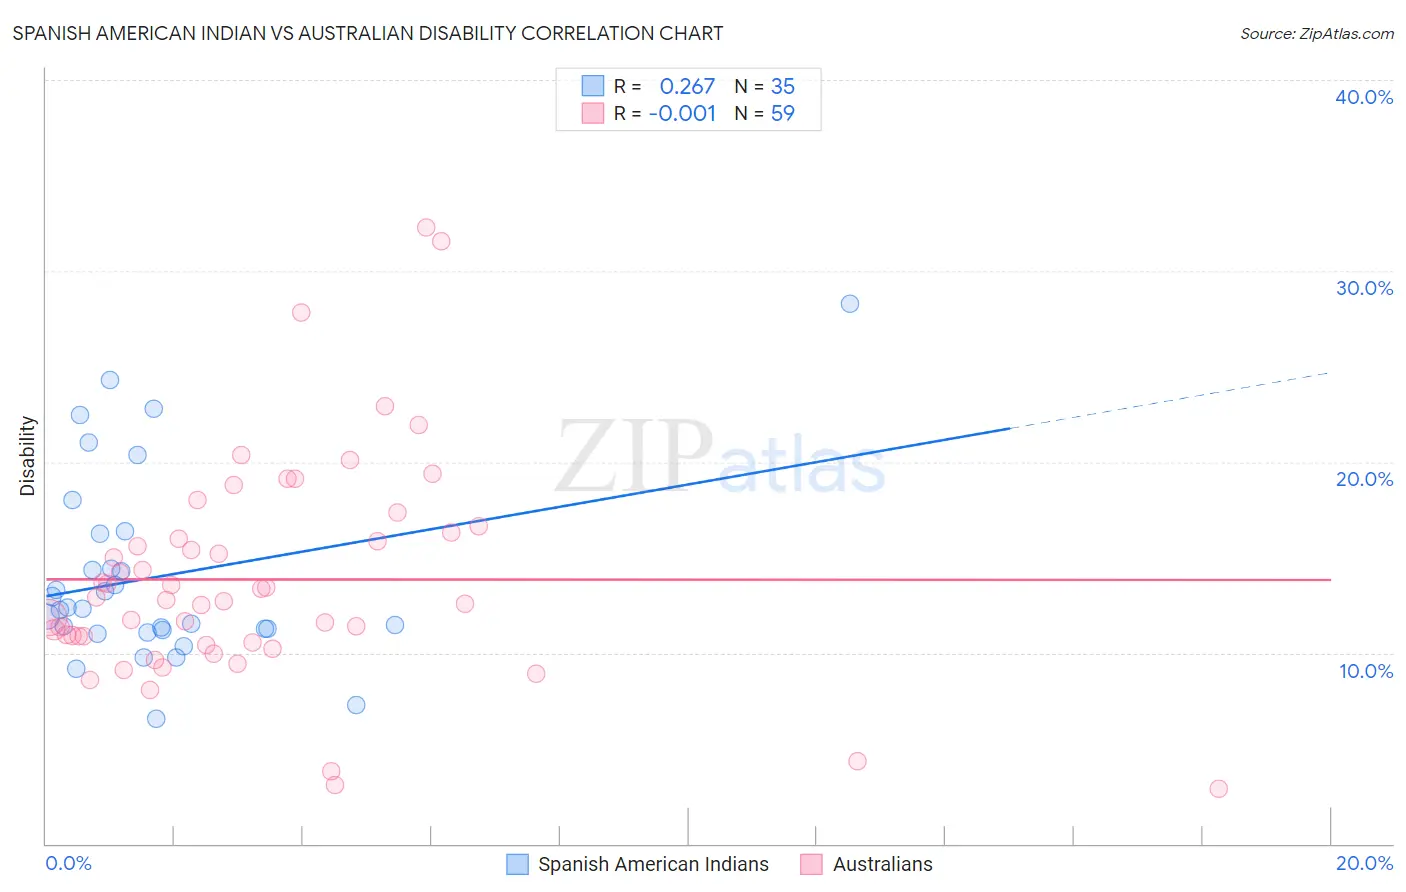
Spanish American Indian vs Australian Disability Correlation Chart
The statistical analysis conducted on geographies consisting of 73,149,525 people shows a weak positive correlation between the proportion of Spanish American Indians and percentage of population with a disability in the United States with a correlation coefficient (R) of 0.267 and weighted average of 12.1%. Similarly, the statistical analysis conducted on geographies consisting of 224,142,596 people shows no correlation between the proportion of Australians and percentage of population with a disability in the United States with a correlation coefficient (R) of -0.001 and weighted average of 11.5%, a difference of 5.3%.
Disability Correlation Summary
| Measurement | Spanish American Indian | Australian |
| Minimum | 6.5% | 2.9% |
| Maximum | 28.3% | 32.3% |
| Range | 21.7% | 29.3% |
| Mean | 14.0% | 13.8% |
| Median | 12.3% | 12.8% |
| Interquartile 25% (IQ1) | 11.2% | 10.6% |
| Interquartile 75% (IQ3) | 16.3% | 16.3% |
| Interquartile Range (IQR) | 5.1% | 5.7% |
| Standard Deviation (Sample) | 4.9% | 5.8% |
| Standard Deviation (Population) | 4.9% | 5.8% |
Similar Demographics by Disability
Demographics Similar to Spanish American Indians by Disability
In terms of disability, the demographic groups most similar to Spanish American Indians are Northern European (12.1%, a difference of 0.040%), Hispanic or Latino (12.1%, a difference of 0.040%), Mexican (12.1%, a difference of 0.10%), Immigrants from Bahamas (12.1%, a difference of 0.16%), and Senegalese (12.1%, a difference of 0.18%).
| Demographics | Rating | Rank | Disability |
| Immigrants | Canada | 6.1 /100 | #215 | Tragic 12.1% |
| Panamanians | 5.4 /100 | #216 | Tragic 12.1% |
| Immigrants | North America | 5.3 /100 | #217 | Tragic 12.1% |
| Immigrants | Jamaica | 5.0 /100 | #218 | Tragic 12.1% |
| Croatians | 4.9 /100 | #219 | Tragic 12.1% |
| Immigrants | Bahamas | 4.7 /100 | #220 | Tragic 12.1% |
| Northern Europeans | 4.2 /100 | #221 | Tragic 12.1% |
| Spanish American Indians | 4.1 /100 | #222 | Tragic 12.1% |
| Hispanics or Latinos | 3.9 /100 | #223 | Tragic 12.1% |
| Mexicans | 3.7 /100 | #224 | Tragic 12.1% |
| Senegalese | 3.5 /100 | #225 | Tragic 12.1% |
| Jamaicans | 3.3 /100 | #226 | Tragic 12.1% |
| Alsatians | 3.3 /100 | #227 | Tragic 12.1% |
| West Indians | 2.9 /100 | #228 | Tragic 12.2% |
| Inupiat | 2.8 /100 | #229 | Tragic 12.2% |
Demographics Similar to Australians by Disability
In terms of disability, the demographic groups most similar to Australians are Moroccan (11.5%, a difference of 0.070%), Nigerian (11.5%, a difference of 0.090%), Immigrants from Sudan (11.5%, a difference of 0.24%), Immigrants from Hungary (11.5%, a difference of 0.25%), and Immigrants from Grenada (11.5%, a difference of 0.31%).
| Demographics | Rating | Rank | Disability |
| Kenyans | 87.1 /100 | #137 | Excellent 11.5% |
| New Zealanders | 87.0 /100 | #138 | Excellent 11.5% |
| Ghanaians | 87.0 /100 | #139 | Excellent 11.5% |
| Russians | 86.8 /100 | #140 | Excellent 11.5% |
| Immigrants | Grenada | 86.1 /100 | #141 | Excellent 11.5% |
| Immigrants | Sudan | 85.3 /100 | #142 | Excellent 11.5% |
| Moroccans | 83.3 /100 | #143 | Excellent 11.5% |
| Australians | 82.5 /100 | #144 | Excellent 11.5% |
| Nigerians | 81.3 /100 | #145 | Excellent 11.5% |
| Immigrants | Hungary | 79.0 /100 | #146 | Good 11.5% |
| Immigrants | Ukraine | 77.6 /100 | #147 | Good 11.5% |
| Sudanese | 77.1 /100 | #148 | Good 11.5% |
| Immigrants | Norway | 73.2 /100 | #149 | Good 11.6% |
| Romanians | 72.7 /100 | #150 | Good 11.6% |
| Immigrants | Kenya | 72.1 /100 | #151 | Good 11.6% |