Immigrants from Portugal vs Native/Alaskan Disability
COMPARE
Immigrants from Portugal
Native/Alaskan
Disability
Disability Comparison
Immigrants from Portugal
Natives/Alaskans
12.9%
DISABILITY
0.0/ 100
METRIC RATING
281st/ 347
METRIC RANK
14.2%
DISABILITY
0.0/ 100
METRIC RATING
325th/ 347
METRIC RANK
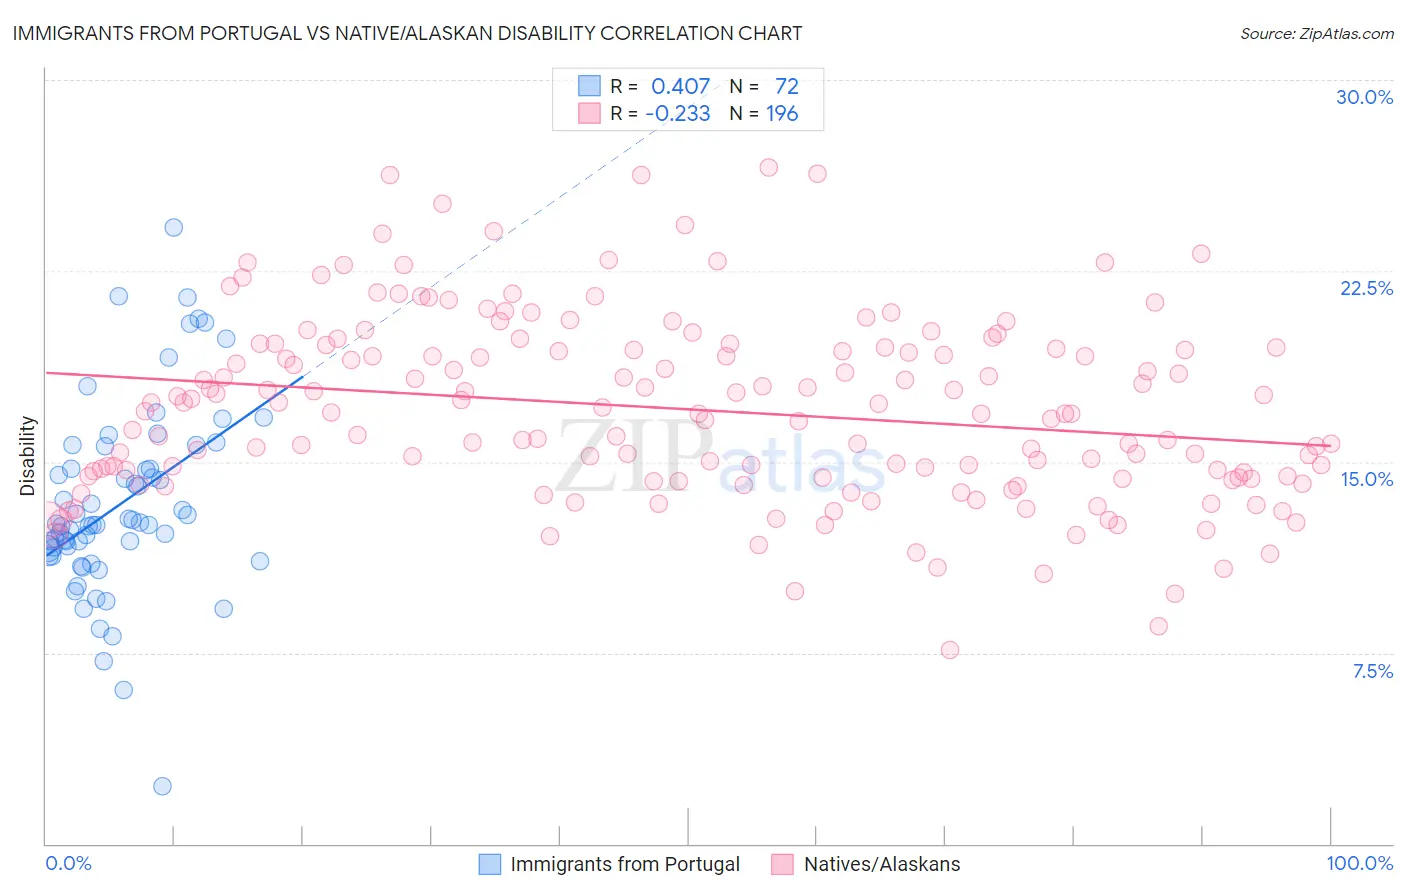
Immigrants from Portugal vs Native/Alaskan Disability Correlation Chart
The statistical analysis conducted on geographies consisting of 174,786,483 people shows a moderate positive correlation between the proportion of Immigrants from Portugal and percentage of population with a disability in the United States with a correlation coefficient (R) of 0.407 and weighted average of 12.9%. Similarly, the statistical analysis conducted on geographies consisting of 512,916,136 people shows a weak negative correlation between the proportion of Natives/Alaskans and percentage of population with a disability in the United States with a correlation coefficient (R) of -0.233 and weighted average of 14.2%, a difference of 10.0%.
Disability Correlation Summary
| Measurement | Immigrants from Portugal | Native/Alaskan |
| Minimum | 2.3% | 7.6% |
| Maximum | 24.2% | 26.5% |
| Range | 21.9% | 18.9% |
| Mean | 13.4% | 17.1% |
| Median | 12.6% | 16.9% |
| Interquartile 25% (IQ1) | 11.4% | 14.4% |
| Interquartile 75% (IQ3) | 15.2% | 19.5% |
| Interquartile Range (IQR) | 3.7% | 5.1% |
| Standard Deviation (Sample) | 3.8% | 3.6% |
| Standard Deviation (Population) | 3.7% | 3.6% |
Similar Demographics by Disability
Demographics Similar to Immigrants from Portugal by Disability
In terms of disability, the demographic groups most similar to Immigrants from Portugal are Spanish (12.8%, a difference of 0.14%), Scottish (12.9%, a difference of 0.14%), Irish (12.9%, a difference of 0.16%), Fijian (12.8%, a difference of 0.19%), and German (12.8%, a difference of 0.29%).
| Demographics | Rating | Rank | Disability |
| Nepalese | 0.0 /100 | #274 | Tragic 12.8% |
| Sioux | 0.0 /100 | #275 | Tragic 12.8% |
| Hmong | 0.0 /100 | #276 | Tragic 12.8% |
| Dutch | 0.0 /100 | #277 | Tragic 12.8% |
| Germans | 0.0 /100 | #278 | Tragic 12.8% |
| Fijians | 0.0 /100 | #279 | Tragic 12.8% |
| Spanish | 0.0 /100 | #280 | Tragic 12.8% |
| Immigrants | Portugal | 0.0 /100 | #281 | Tragic 12.9% |
| Scottish | 0.0 /100 | #282 | Tragic 12.9% |
| Irish | 0.0 /100 | #283 | Tragic 12.9% |
| Welsh | 0.0 /100 | #284 | Tragic 12.9% |
| Crow | 0.0 /100 | #285 | Tragic 12.9% |
| English | 0.0 /100 | #286 | Tragic 13.0% |
| Africans | 0.0 /100 | #287 | Tragic 13.0% |
| Whites/Caucasians | 0.0 /100 | #288 | Tragic 13.0% |
Demographics Similar to Natives/Alaskans by Disability
In terms of disability, the demographic groups most similar to Natives/Alaskans are Osage (14.2%, a difference of 0.030%), Chippewa (14.1%, a difference of 0.050%), Ottawa (14.2%, a difference of 0.060%), Immigrants from the Azores (14.2%, a difference of 0.060%), and Potawatomi (14.2%, a difference of 0.17%).
| Demographics | Rating | Rank | Disability |
| Menominee | 0.0 /100 | #318 | Tragic 13.8% |
| Iroquois | 0.0 /100 | #319 | Tragic 13.8% |
| Apache | 0.0 /100 | #320 | Tragic 13.9% |
| Paiute | 0.0 /100 | #321 | Tragic 13.9% |
| Americans | 0.0 /100 | #322 | Tragic 13.9% |
| Comanche | 0.0 /100 | #323 | Tragic 14.1% |
| Chippewa | 0.0 /100 | #324 | Tragic 14.1% |
| Natives/Alaskans | 0.0 /100 | #325 | Tragic 14.2% |
| Osage | 0.0 /100 | #326 | Tragic 14.2% |
| Ottawa | 0.0 /100 | #327 | Tragic 14.2% |
| Immigrants | Azores | 0.0 /100 | #328 | Tragic 14.2% |
| Potawatomi | 0.0 /100 | #329 | Tragic 14.2% |
| Navajo | 0.0 /100 | #330 | Tragic 14.3% |
| Alaskan Athabascans | 0.0 /100 | #331 | Tragic 14.4% |
| Pueblo | 0.0 /100 | #332 | Tragic 14.4% |