Immigrants from El Salvador vs Australian Disability
COMPARE
Immigrants from El Salvador
Australian
Disability
Disability Comparison
Immigrants from El Salvador
Australians
10.9%
DISABILITY
99.8/ 100
METRIC RATING
55th/ 347
METRIC RANK
11.5%
DISABILITY
82.5/ 100
METRIC RATING
144th/ 347
METRIC RANK
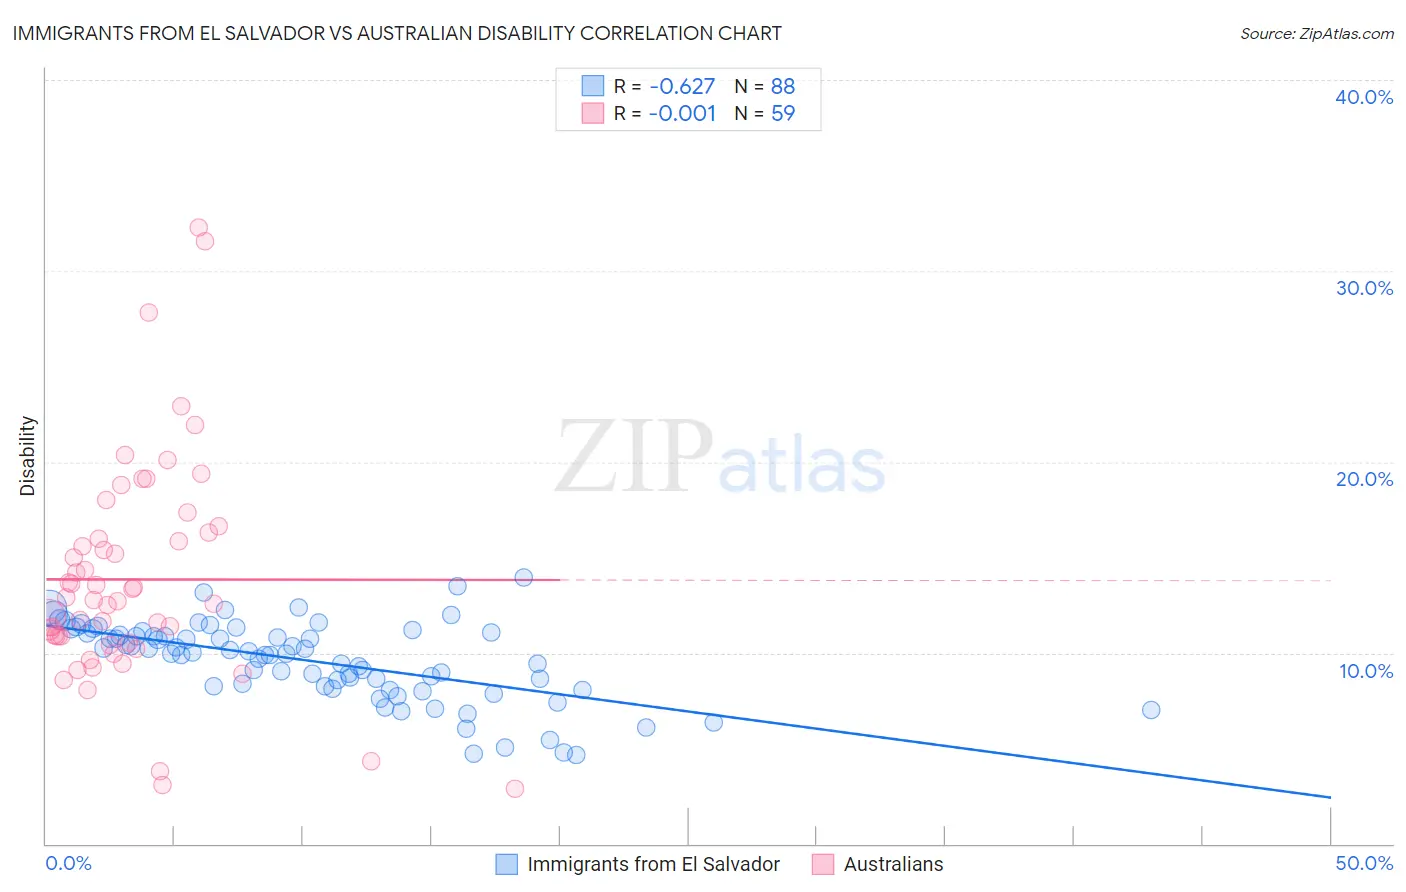
Immigrants from El Salvador vs Australian Disability Correlation Chart
The statistical analysis conducted on geographies consisting of 357,766,367 people shows a significant negative correlation between the proportion of Immigrants from El Salvador and percentage of population with a disability in the United States with a correlation coefficient (R) of -0.627 and weighted average of 10.9%. Similarly, the statistical analysis conducted on geographies consisting of 224,142,596 people shows no correlation between the proportion of Australians and percentage of population with a disability in the United States with a correlation coefficient (R) of -0.001 and weighted average of 11.5%, a difference of 5.7%.
Disability Correlation Summary
| Measurement | Immigrants from El Salvador | Australian |
| Minimum | 4.6% | 2.9% |
| Maximum | 13.9% | 32.3% |
| Range | 9.3% | 29.3% |
| Mean | 9.6% | 13.8% |
| Median | 10.0% | 12.8% |
| Interquartile 25% (IQ1) | 8.2% | 10.6% |
| Interquartile 75% (IQ3) | 11.0% | 16.3% |
| Interquartile Range (IQR) | 2.8% | 5.7% |
| Standard Deviation (Sample) | 2.0% | 5.8% |
| Standard Deviation (Population) | 2.0% | 5.8% |
Similar Demographics by Disability
Demographics Similar to Immigrants from El Salvador by Disability
In terms of disability, the demographic groups most similar to Immigrants from El Salvador are Immigrants from Spain (10.9%, a difference of 0.090%), Jordanian (10.9%, a difference of 0.090%), South American (10.9%, a difference of 0.11%), Immigrants from Lithuania (10.9%, a difference of 0.11%), and Peruvian (10.9%, a difference of 0.16%).
| Demographics | Rating | Rank | Disability |
| Soviet Union | 99.9 /100 | #48 | Exceptional 10.9% |
| Vietnamese | 99.9 /100 | #49 | Exceptional 10.9% |
| Immigrants | Saudi Arabia | 99.9 /100 | #50 | Exceptional 10.9% |
| Peruvians | 99.8 /100 | #51 | Exceptional 10.9% |
| South Americans | 99.8 /100 | #52 | Exceptional 10.9% |
| Immigrants | Spain | 99.8 /100 | #53 | Exceptional 10.9% |
| Jordanians | 99.8 /100 | #54 | Exceptional 10.9% |
| Immigrants | El Salvador | 99.8 /100 | #55 | Exceptional 10.9% |
| Immigrants | Lithuania | 99.8 /100 | #56 | Exceptional 10.9% |
| Salvadorans | 99.8 /100 | #57 | Exceptional 10.9% |
| Immigrants | South America | 99.8 /100 | #58 | Exceptional 10.9% |
| Immigrants | Colombia | 99.7 /100 | #59 | Exceptional 10.9% |
| Zimbabweans | 99.7 /100 | #60 | Exceptional 10.9% |
| Immigrants | Bulgaria | 99.7 /100 | #61 | Exceptional 10.9% |
| Immigrants | Northern Africa | 99.7 /100 | #62 | Exceptional 10.9% |
Demographics Similar to Australians by Disability
In terms of disability, the demographic groups most similar to Australians are Moroccan (11.5%, a difference of 0.070%), Nigerian (11.5%, a difference of 0.090%), Immigrants from Sudan (11.5%, a difference of 0.24%), Immigrants from Hungary (11.5%, a difference of 0.25%), and Immigrants from Grenada (11.5%, a difference of 0.31%).
| Demographics | Rating | Rank | Disability |
| Kenyans | 87.1 /100 | #137 | Excellent 11.5% |
| New Zealanders | 87.0 /100 | #138 | Excellent 11.5% |
| Ghanaians | 87.0 /100 | #139 | Excellent 11.5% |
| Russians | 86.8 /100 | #140 | Excellent 11.5% |
| Immigrants | Grenada | 86.1 /100 | #141 | Excellent 11.5% |
| Immigrants | Sudan | 85.3 /100 | #142 | Excellent 11.5% |
| Moroccans | 83.3 /100 | #143 | Excellent 11.5% |
| Australians | 82.5 /100 | #144 | Excellent 11.5% |
| Nigerians | 81.3 /100 | #145 | Excellent 11.5% |
| Immigrants | Hungary | 79.0 /100 | #146 | Good 11.5% |
| Immigrants | Ukraine | 77.6 /100 | #147 | Good 11.5% |
| Sudanese | 77.1 /100 | #148 | Good 11.5% |
| Immigrants | Norway | 73.2 /100 | #149 | Good 11.6% |
| Romanians | 72.7 /100 | #150 | Good 11.6% |
| Immigrants | Kenya | 72.1 /100 | #151 | Good 11.6% |