Immigrants from Portugal vs Estonian Disability Age Under 5
COMPARE
Immigrants from Portugal
Estonian
Disability Age Under 5
Disability Age Under 5 Comparison
Immigrants from Portugal
Estonians
1.8%
DISABILITY AGE UNDER 5
0.0/ 100
METRIC RATING
325th/ 347
METRIC RANK
1.5%
DISABILITY AGE UNDER 5
0.0/ 100
METRIC RATING
288th/ 347
METRIC RANK
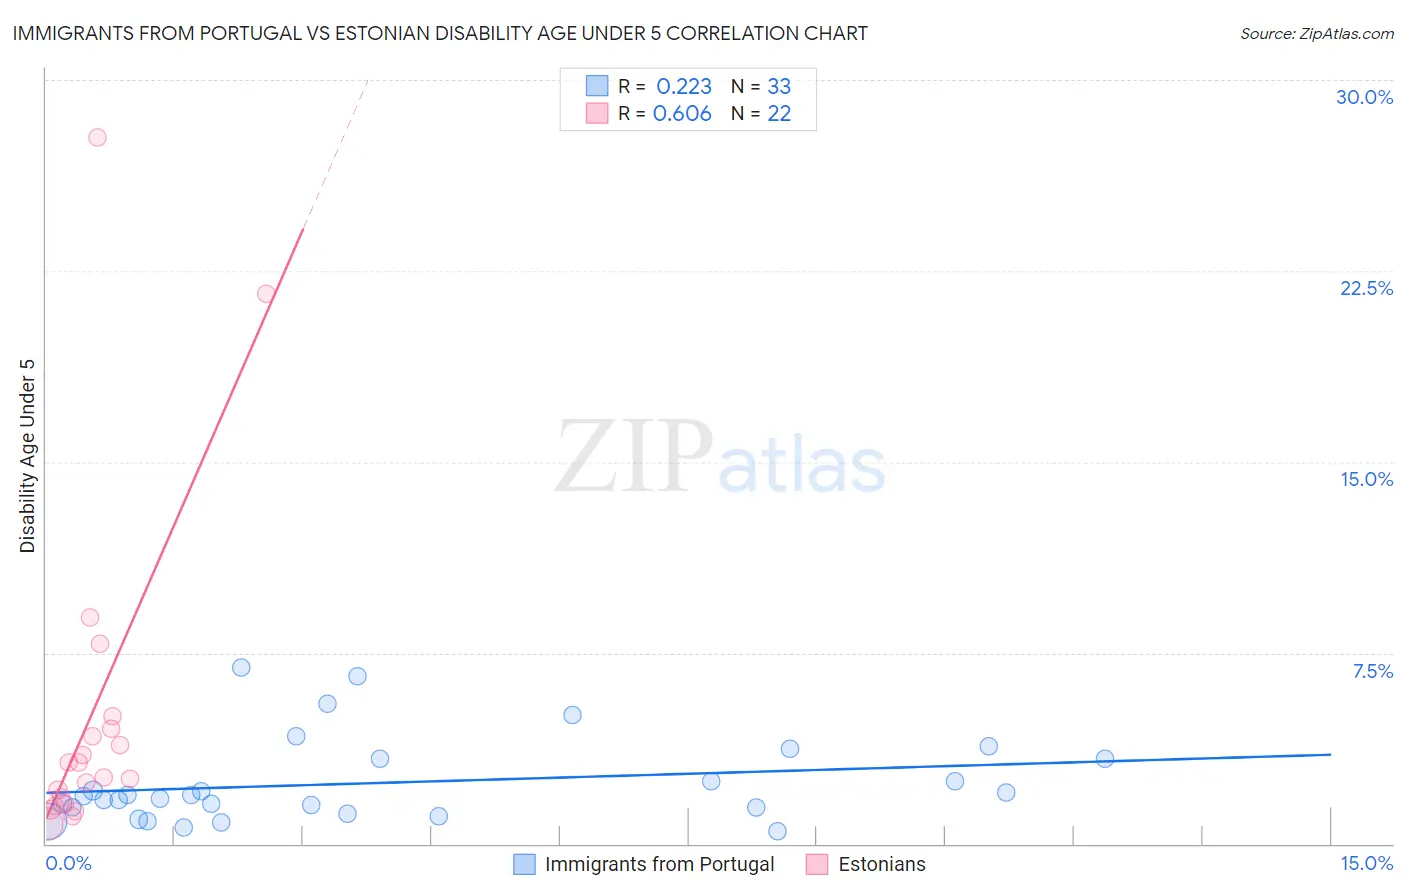
Immigrants from Portugal vs Estonian Disability Age Under 5 Correlation Chart
The statistical analysis conducted on geographies consisting of 112,092,431 people shows a weak positive correlation between the proportion of Immigrants from Portugal and percentage of population with a disability under the age of 5 in the United States with a correlation coefficient (R) of 0.223 and weighted average of 1.8%. Similarly, the statistical analysis conducted on geographies consisting of 87,399,197 people shows a significant positive correlation between the proportion of Estonians and percentage of population with a disability under the age of 5 in the United States with a correlation coefficient (R) of 0.606 and weighted average of 1.5%, a difference of 16.1%.
Disability Age Under 5 Correlation Summary
| Measurement | Immigrants from Portugal | Estonian |
| Minimum | 0.48% | 0.77% |
| Maximum | 6.9% | 27.7% |
| Range | 6.5% | 27.0% |
| Mean | 2.4% | 5.1% |
| Median | 1.9% | 2.9% |
| Interquartile 25% (IQ1) | 1.3% | 1.6% |
| Interquartile 75% (IQ3) | 3.4% | 4.5% |
| Interquartile Range (IQR) | 2.1% | 2.9% |
| Standard Deviation (Sample) | 1.7% | 6.7% |
| Standard Deviation (Population) | 1.6% | 6.6% |
Similar Demographics by Disability Age Under 5
Demographics Similar to Immigrants from Portugal by Disability Age Under 5
In terms of disability age under 5, the demographic groups most similar to Immigrants from Portugal are Cherokee (1.8%, a difference of 1.3%), Sioux (1.8%, a difference of 1.4%), Osage (1.8%, a difference of 1.8%), Chickasaw (1.7%, a difference of 3.1%), and American (1.9%, a difference of 3.5%).
| Demographics | Rating | Rank | Disability Age Under 5 |
| Irish | 0.0 /100 | #318 | Tragic 1.7% |
| Slovaks | 0.0 /100 | #319 | Tragic 1.7% |
| Scotch-Irish | 0.0 /100 | #320 | Tragic 1.7% |
| Ottawa | 0.0 /100 | #321 | Tragic 1.7% |
| Germans | 0.0 /100 | #322 | Tragic 1.7% |
| Chickasaw | 0.0 /100 | #323 | Tragic 1.7% |
| Cherokee | 0.0 /100 | #324 | Tragic 1.8% |
| Immigrants | Portugal | 0.0 /100 | #325 | Tragic 1.8% |
| Sioux | 0.0 /100 | #326 | Tragic 1.8% |
| Osage | 0.0 /100 | #327 | Tragic 1.8% |
| Americans | 0.0 /100 | #328 | Tragic 1.9% |
| Houma | 0.0 /100 | #329 | Tragic 1.9% |
| Choctaw | 0.0 /100 | #330 | Tragic 1.9% |
| French Canadians | 0.0 /100 | #331 | Tragic 1.9% |
| Chippewa | 0.0 /100 | #332 | Tragic 1.9% |
Demographics Similar to Estonians by Disability Age Under 5
In terms of disability age under 5, the demographic groups most similar to Estonians are Hungarian (1.5%, a difference of 0.14%), Scandinavian (1.5%, a difference of 0.18%), Tlingit-Haida (1.5%, a difference of 0.23%), Czech (1.5%, a difference of 0.26%), and Northern European (1.6%, a difference of 0.36%).
| Demographics | Rating | Rank | Disability Age Under 5 |
| Czechoslovakians | 0.0 /100 | #281 | Tragic 1.5% |
| Cheyenne | 0.0 /100 | #282 | Tragic 1.5% |
| Delaware | 0.0 /100 | #283 | Tragic 1.5% |
| Europeans | 0.0 /100 | #284 | Tragic 1.5% |
| Croatians | 0.0 /100 | #285 | Tragic 1.5% |
| Tlingit-Haida | 0.0 /100 | #286 | Tragic 1.5% |
| Scandinavians | 0.0 /100 | #287 | Tragic 1.5% |
| Estonians | 0.0 /100 | #288 | Tragic 1.5% |
| Hungarians | 0.0 /100 | #289 | Tragic 1.5% |
| Czechs | 0.0 /100 | #290 | Tragic 1.5% |
| Northern Europeans | 0.0 /100 | #291 | Tragic 1.6% |
| Italians | 0.0 /100 | #292 | Tragic 1.6% |
| Lithuanians | 0.0 /100 | #293 | Tragic 1.6% |
| Swedes | 0.0 /100 | #294 | Tragic 1.6% |
| Finns | 0.0 /100 | #295 | Tragic 1.6% |