Colombian vs Immigrants from Senegal Disability Age 5 to 17
COMPARE
Colombian
Immigrants from Senegal
Disability Age 5 to 17
Disability Age 5 to 17 Comparison
Colombians
Immigrants from Senegal
5.5%
DISABILITY AGE 5 TO 17
88.0/ 100
METRIC RATING
142nd/ 347
METRIC RANK
6.2%
DISABILITY AGE 5 TO 17
0.0/ 100
METRIC RATING
292nd/ 347
METRIC RANK
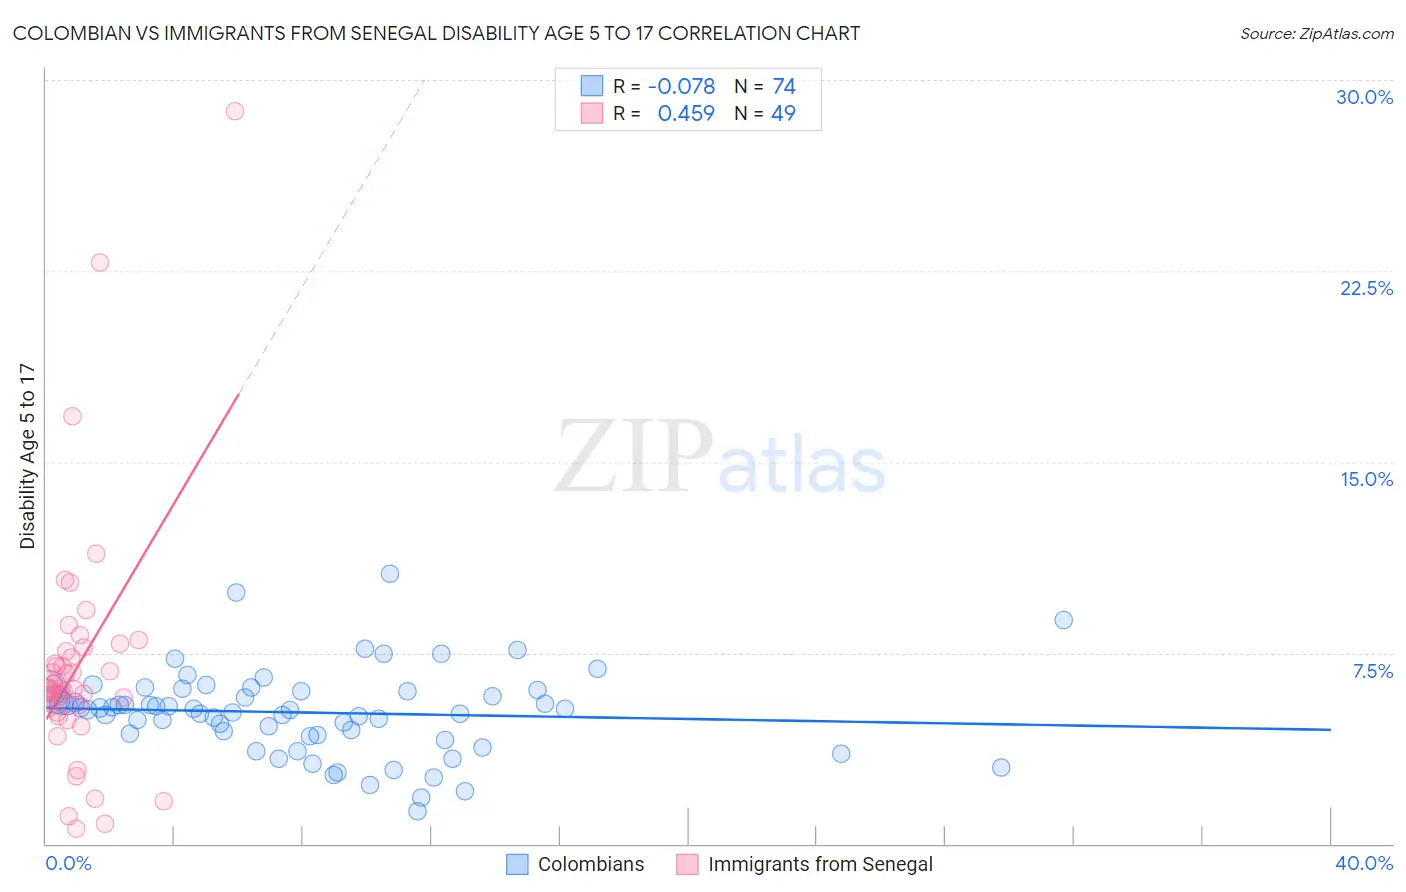
Colombian vs Immigrants from Senegal Disability Age 5 to 17 Correlation Chart
The statistical analysis conducted on geographies consisting of 416,048,287 people shows a slight negative correlation between the proportion of Colombians and percentage of population with a disability between the ages 5 and 17 in the United States with a correlation coefficient (R) of -0.078 and weighted average of 5.5%. Similarly, the statistical analysis conducted on geographies consisting of 90,044,083 people shows a moderate positive correlation between the proportion of Immigrants from Senegal and percentage of population with a disability between the ages 5 and 17 in the United States with a correlation coefficient (R) of 0.459 and weighted average of 6.2%, a difference of 13.8%.
Disability Age 5 to 17 Correlation Summary
| Measurement | Colombian | Immigrants from Senegal |
| Minimum | 1.3% | 0.58% |
| Maximum | 10.6% | 28.8% |
| Range | 9.3% | 28.2% |
| Mean | 5.2% | 7.0% |
| Median | 5.3% | 6.1% |
| Interquartile 25% (IQ1) | 4.3% | 5.3% |
| Interquartile 75% (IQ3) | 6.0% | 7.6% |
| Interquartile Range (IQR) | 1.7% | 2.3% |
| Standard Deviation (Sample) | 1.7% | 4.8% |
| Standard Deviation (Population) | 1.7% | 4.8% |
Similar Demographics by Disability Age 5 to 17
Demographics Similar to Colombians by Disability Age 5 to 17
In terms of disability age 5 to 17, the demographic groups most similar to Colombians are Immigrants from Hungary (5.5%, a difference of 0.020%), Pakistani (5.5%, a difference of 0.090%), South American Indian (5.5%, a difference of 0.15%), Immigrants from Guatemala (5.5%, a difference of 0.16%), and Immigrants from Netherlands (5.4%, a difference of 0.32%).
| Demographics | Rating | Rank | Disability Age 5 to 17 |
| Immigrants | Belize | 91.7 /100 | #135 | Exceptional 5.4% |
| Immigrants | Denmark | 91.4 /100 | #136 | Exceptional 5.4% |
| Navajo | 90.9 /100 | #137 | Exceptional 5.4% |
| Immigrants | Oceania | 90.8 /100 | #138 | Exceptional 5.4% |
| Belizeans | 90.8 /100 | #139 | Exceptional 5.4% |
| Immigrants | Netherlands | 90.5 /100 | #140 | Exceptional 5.4% |
| South American Indians | 89.3 /100 | #141 | Excellent 5.5% |
| Colombians | 88.0 /100 | #142 | Excellent 5.5% |
| Immigrants | Hungary | 87.9 /100 | #143 | Excellent 5.5% |
| Pakistanis | 87.3 /100 | #144 | Excellent 5.5% |
| Immigrants | Guatemala | 86.6 /100 | #145 | Excellent 5.5% |
| Albanians | 83.7 /100 | #146 | Excellent 5.5% |
| Immigrants | Albania | 83.1 /100 | #147 | Excellent 5.5% |
| Samoans | 81.9 /100 | #148 | Excellent 5.5% |
| Central Americans | 81.6 /100 | #149 | Excellent 5.5% |
Demographics Similar to Immigrants from Senegal by Disability Age 5 to 17
In terms of disability age 5 to 17, the demographic groups most similar to Immigrants from Senegal are Central American Indian (6.2%, a difference of 0.020%), Irish (6.2%, a difference of 0.020%), White/Caucasian (6.2%, a difference of 0.24%), Cree (6.2%, a difference of 0.29%), and Spanish American (6.2%, a difference of 0.32%).
| Demographics | Rating | Rank | Disability Age 5 to 17 |
| English | 0.0 /100 | #285 | Tragic 6.2% |
| Colville | 0.0 /100 | #286 | Tragic 6.2% |
| Pima | 0.0 /100 | #287 | Tragic 6.2% |
| Jamaicans | 0.0 /100 | #288 | Tragic 6.2% |
| Yaqui | 0.0 /100 | #289 | Tragic 6.2% |
| Immigrants | Congo | 0.0 /100 | #290 | Tragic 6.2% |
| Whites/Caucasians | 0.0 /100 | #291 | Tragic 6.2% |
| Immigrants | Senegal | 0.0 /100 | #292 | Tragic 6.2% |
| Central American Indians | 0.0 /100 | #293 | Tragic 6.2% |
| Irish | 0.0 /100 | #294 | Tragic 6.2% |
| Cree | 0.0 /100 | #295 | Tragic 6.2% |
| Spanish Americans | 0.0 /100 | #296 | Tragic 6.2% |
| Immigrants | Bahamas | 0.0 /100 | #297 | Tragic 6.2% |
| Lumbee | 0.0 /100 | #298 | Tragic 6.2% |
| Welsh | 0.0 /100 | #299 | Tragic 6.3% |