Immigrants from Middle Africa vs Polish Ambulatory Disability
COMPARE
Immigrants from Middle Africa
Polish
Ambulatory Disability
Ambulatory Disability Comparison
Immigrants from Middle Africa
Poles
5.9%
AMBULATORY DISABILITY
92.2/ 100
METRIC RATING
124th/ 347
METRIC RANK
6.2%
AMBULATORY DISABILITY
26.3/ 100
METRIC RATING
197th/ 347
METRIC RANK
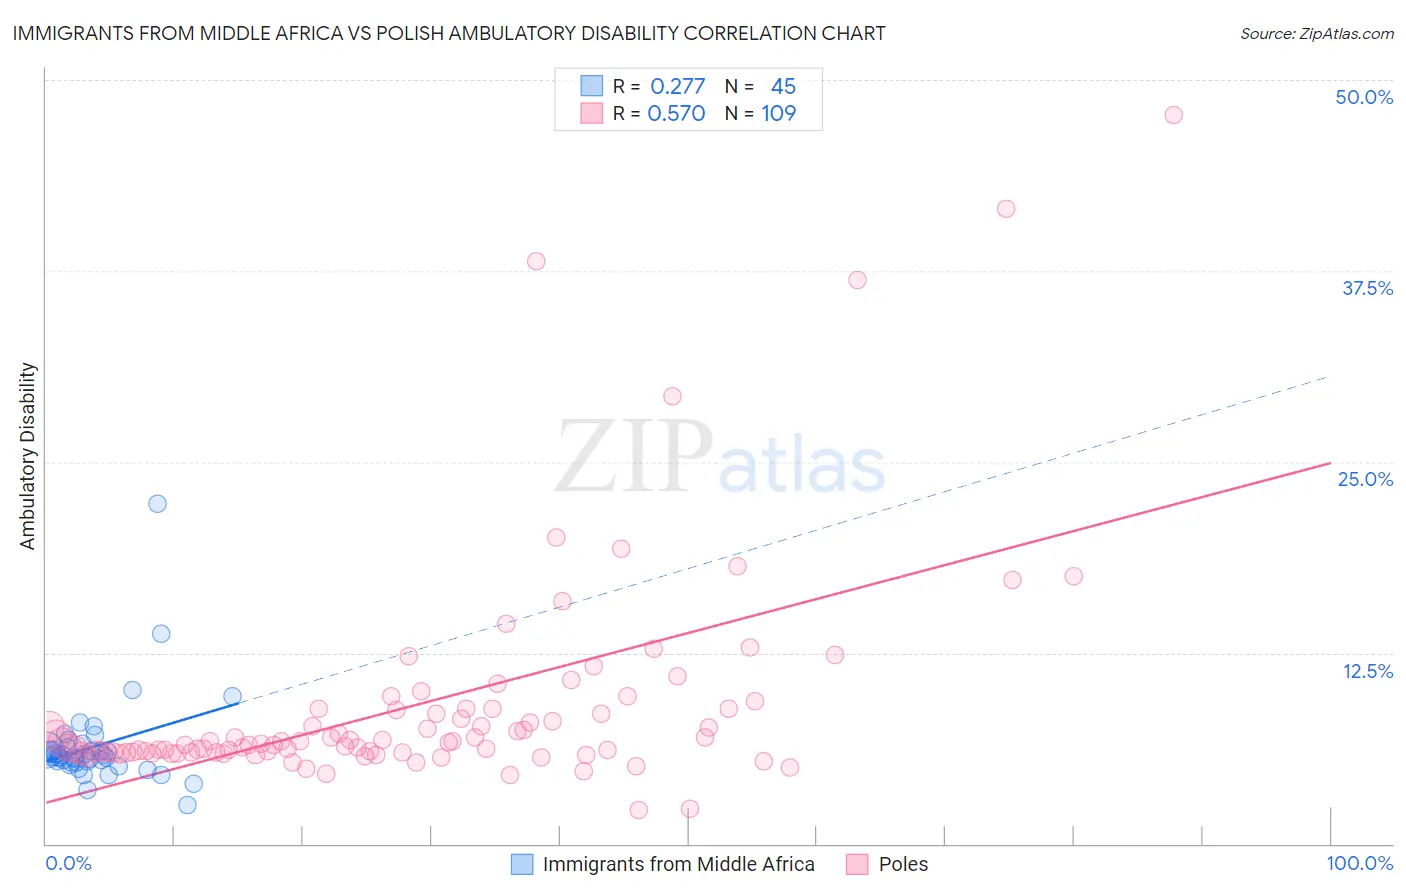
Immigrants from Middle Africa vs Polish Ambulatory Disability Correlation Chart
The statistical analysis conducted on geographies consisting of 202,691,189 people shows a weak positive correlation between the proportion of Immigrants from Middle Africa and percentage of population with ambulatory disability in the United States with a correlation coefficient (R) of 0.277 and weighted average of 5.9%. Similarly, the statistical analysis conducted on geographies consisting of 560,051,234 people shows a substantial positive correlation between the proportion of Poles and percentage of population with ambulatory disability in the United States with a correlation coefficient (R) of 0.570 and weighted average of 6.2%, a difference of 4.8%.
Ambulatory Disability Correlation Summary
| Measurement | Immigrants from Middle Africa | Polish |
| Minimum | 2.5% | 2.2% |
| Maximum | 22.3% | 47.7% |
| Range | 19.7% | 45.5% |
| Mean | 6.4% | 9.1% |
| Median | 5.7% | 6.6% |
| Interquartile 25% (IQ1) | 5.3% | 6.0% |
| Interquartile 75% (IQ3) | 6.2% | 8.8% |
| Interquartile Range (IQR) | 0.93% | 2.8% |
| Standard Deviation (Sample) | 3.0% | 7.4% |
| Standard Deviation (Population) | 3.0% | 7.3% |
Similar Demographics by Ambulatory Disability
Demographics Similar to Immigrants from Middle Africa by Ambulatory Disability
In terms of ambulatory disability, the demographic groups most similar to Immigrants from Middle Africa are Immigrants from Russia (5.9%, a difference of 0.040%), Costa Rican (5.9%, a difference of 0.060%), Icelander (5.9%, a difference of 0.060%), Korean (5.9%, a difference of 0.12%), and Estonian (5.9%, a difference of 0.13%).
| Demographics | Rating | Rank | Ambulatory Disability |
| Immigrants | South Eastern Asia | 93.6 /100 | #117 | Exceptional 5.9% |
| Russians | 93.4 /100 | #118 | Exceptional 5.9% |
| Norwegians | 93.1 /100 | #119 | Exceptional 5.9% |
| Estonians | 92.9 /100 | #120 | Exceptional 5.9% |
| Costa Ricans | 92.6 /100 | #121 | Exceptional 5.9% |
| Icelanders | 92.6 /100 | #122 | Exceptional 5.9% |
| Immigrants | Russia | 92.4 /100 | #123 | Exceptional 5.9% |
| Immigrants | Middle Africa | 92.2 /100 | #124 | Exceptional 5.9% |
| Koreans | 91.6 /100 | #125 | Exceptional 5.9% |
| Arabs | 91.5 /100 | #126 | Exceptional 5.9% |
| Immigrants | Nigeria | 90.9 /100 | #127 | Exceptional 5.9% |
| Immigrants | Western Asia | 90.7 /100 | #128 | Exceptional 5.9% |
| Immigrants | Norway | 90.5 /100 | #129 | Exceptional 5.9% |
| Immigrants | Kazakhstan | 89.7 /100 | #130 | Excellent 5.9% |
| Immigrants | Costa Rica | 89.5 /100 | #131 | Excellent 5.9% |
Demographics Similar to Poles by Ambulatory Disability
In terms of ambulatory disability, the demographic groups most similar to Poles are Malaysian (6.2%, a difference of 0.12%), Immigrants from Bangladesh (6.2%, a difference of 0.12%), Belgian (6.2%, a difference of 0.15%), Alaska Native (6.2%, a difference of 0.23%), and Guatemalan (6.2%, a difference of 0.24%).
| Demographics | Rating | Rank | Ambulatory Disability |
| Immigrants | Western Africa | 33.4 /100 | #190 | Fair 6.2% |
| Immigrants | Guatemala | 31.9 /100 | #191 | Fair 6.2% |
| Immigrants | Western Europe | 31.6 /100 | #192 | Fair 6.2% |
| Guatemalans | 30.0 /100 | #193 | Fair 6.2% |
| Alaska Natives | 29.8 /100 | #194 | Fair 6.2% |
| Belgians | 28.6 /100 | #195 | Fair 6.2% |
| Malaysians | 28.2 /100 | #196 | Fair 6.2% |
| Poles | 26.3 /100 | #197 | Fair 6.2% |
| Immigrants | Bangladesh | 24.6 /100 | #198 | Fair 6.2% |
| Italians | 22.6 /100 | #199 | Fair 6.2% |
| Immigrants | Cambodia | 21.5 /100 | #200 | Fair 6.2% |
| Immigrants | Central America | 20.1 /100 | #201 | Fair 6.2% |
| Albanians | 19.7 /100 | #202 | Poor 6.2% |
| Immigrants | Ukraine | 18.4 /100 | #203 | Poor 6.2% |
| Immigrants | Congo | 18.2 /100 | #204 | Poor 6.2% |