Immigrants from Pakistan vs Polish Ambulatory Disability
COMPARE
Immigrants from Pakistan
Polish
Ambulatory Disability
Ambulatory Disability Comparison
Immigrants from Pakistan
Poles
5.5%
AMBULATORY DISABILITY
100.0/ 100
METRIC RATING
33rd/ 347
METRIC RANK
6.2%
AMBULATORY DISABILITY
26.3/ 100
METRIC RATING
197th/ 347
METRIC RANK
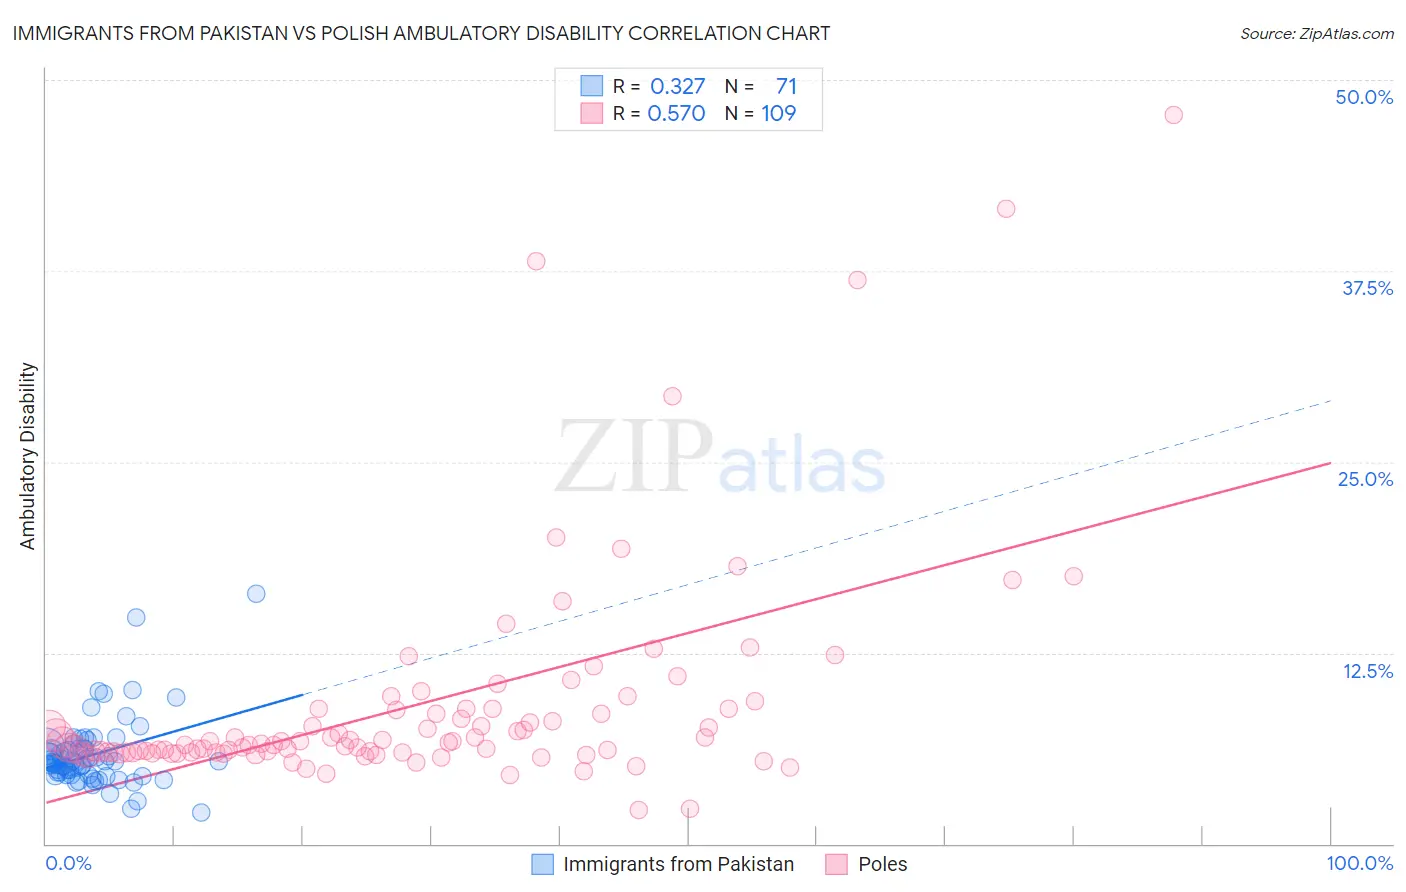
Immigrants from Pakistan vs Polish Ambulatory Disability Correlation Chart
The statistical analysis conducted on geographies consisting of 283,855,056 people shows a mild positive correlation between the proportion of Immigrants from Pakistan and percentage of population with ambulatory disability in the United States with a correlation coefficient (R) of 0.327 and weighted average of 5.5%. Similarly, the statistical analysis conducted on geographies consisting of 560,051,234 people shows a substantial positive correlation between the proportion of Poles and percentage of population with ambulatory disability in the United States with a correlation coefficient (R) of 0.570 and weighted average of 6.2%, a difference of 13.5%.
Ambulatory Disability Correlation Summary
| Measurement | Immigrants from Pakistan | Polish |
| Minimum | 2.0% | 2.2% |
| Maximum | 16.3% | 47.7% |
| Range | 14.3% | 45.5% |
| Mean | 5.8% | 9.1% |
| Median | 5.4% | 6.6% |
| Interquartile 25% (IQ1) | 4.5% | 6.0% |
| Interquartile 75% (IQ3) | 6.2% | 8.8% |
| Interquartile Range (IQR) | 1.7% | 2.8% |
| Standard Deviation (Sample) | 2.3% | 7.4% |
| Standard Deviation (Population) | 2.3% | 7.3% |
Similar Demographics by Ambulatory Disability
Demographics Similar to Immigrants from Pakistan by Ambulatory Disability
In terms of ambulatory disability, the demographic groups most similar to Immigrants from Pakistan are Immigrants from Australia (5.5%, a difference of 0.12%), Immigrants from Asia (5.5%, a difference of 0.16%), Afghan (5.5%, a difference of 0.20%), Immigrants from Malaysia (5.5%, a difference of 0.27%), and Turkish (5.5%, a difference of 0.28%).
| Demographics | Rating | Rank | Ambulatory Disability |
| Immigrants | Nepal | 100.0 /100 | #26 | Exceptional 5.4% |
| Asians | 100.0 /100 | #27 | Exceptional 5.4% |
| Cambodians | 100.0 /100 | #28 | Exceptional 5.4% |
| Immigrants | Iran | 100.0 /100 | #29 | Exceptional 5.4% |
| Immigrants | Turkey | 100.0 /100 | #30 | Exceptional 5.4% |
| Immigrants | Venezuela | 100.0 /100 | #31 | Exceptional 5.4% |
| Immigrants | Australia | 100.0 /100 | #32 | Exceptional 5.5% |
| Immigrants | Pakistan | 100.0 /100 | #33 | Exceptional 5.5% |
| Immigrants | Asia | 100.0 /100 | #34 | Exceptional 5.5% |
| Afghans | 100.0 /100 | #35 | Exceptional 5.5% |
| Immigrants | Malaysia | 100.0 /100 | #36 | Exceptional 5.5% |
| Turks | 100.0 /100 | #37 | Exceptional 5.5% |
| Cypriots | 100.0 /100 | #38 | Exceptional 5.5% |
| Immigrants | Eritrea | 100.0 /100 | #39 | Exceptional 5.5% |
| Venezuelans | 99.9 /100 | #40 | Exceptional 5.5% |
Demographics Similar to Poles by Ambulatory Disability
In terms of ambulatory disability, the demographic groups most similar to Poles are Malaysian (6.2%, a difference of 0.12%), Immigrants from Bangladesh (6.2%, a difference of 0.12%), Belgian (6.2%, a difference of 0.15%), Alaska Native (6.2%, a difference of 0.23%), and Guatemalan (6.2%, a difference of 0.24%).
| Demographics | Rating | Rank | Ambulatory Disability |
| Immigrants | Western Africa | 33.4 /100 | #190 | Fair 6.2% |
| Immigrants | Guatemala | 31.9 /100 | #191 | Fair 6.2% |
| Immigrants | Western Europe | 31.6 /100 | #192 | Fair 6.2% |
| Guatemalans | 30.0 /100 | #193 | Fair 6.2% |
| Alaska Natives | 29.8 /100 | #194 | Fair 6.2% |
| Belgians | 28.6 /100 | #195 | Fair 6.2% |
| Malaysians | 28.2 /100 | #196 | Fair 6.2% |
| Poles | 26.3 /100 | #197 | Fair 6.2% |
| Immigrants | Bangladesh | 24.6 /100 | #198 | Fair 6.2% |
| Italians | 22.6 /100 | #199 | Fair 6.2% |
| Immigrants | Cambodia | 21.5 /100 | #200 | Fair 6.2% |
| Immigrants | Central America | 20.1 /100 | #201 | Fair 6.2% |
| Albanians | 19.7 /100 | #202 | Poor 6.2% |
| Immigrants | Ukraine | 18.4 /100 | #203 | Poor 6.2% |
| Immigrants | Congo | 18.2 /100 | #204 | Poor 6.2% |