Immigrants from Middle Africa vs Polish Doctorate Degree
COMPARE
Immigrants from Middle Africa
Polish
Doctorate Degree
Doctorate Degree Comparison
Immigrants from Middle Africa
Poles
1.9%
DOCTORATE DEGREE
68.8/ 100
METRIC RATING
161st/ 347
METRIC RANK
1.9%
DOCTORATE DEGREE
72.7/ 100
METRIC RATING
155th/ 347
METRIC RANK
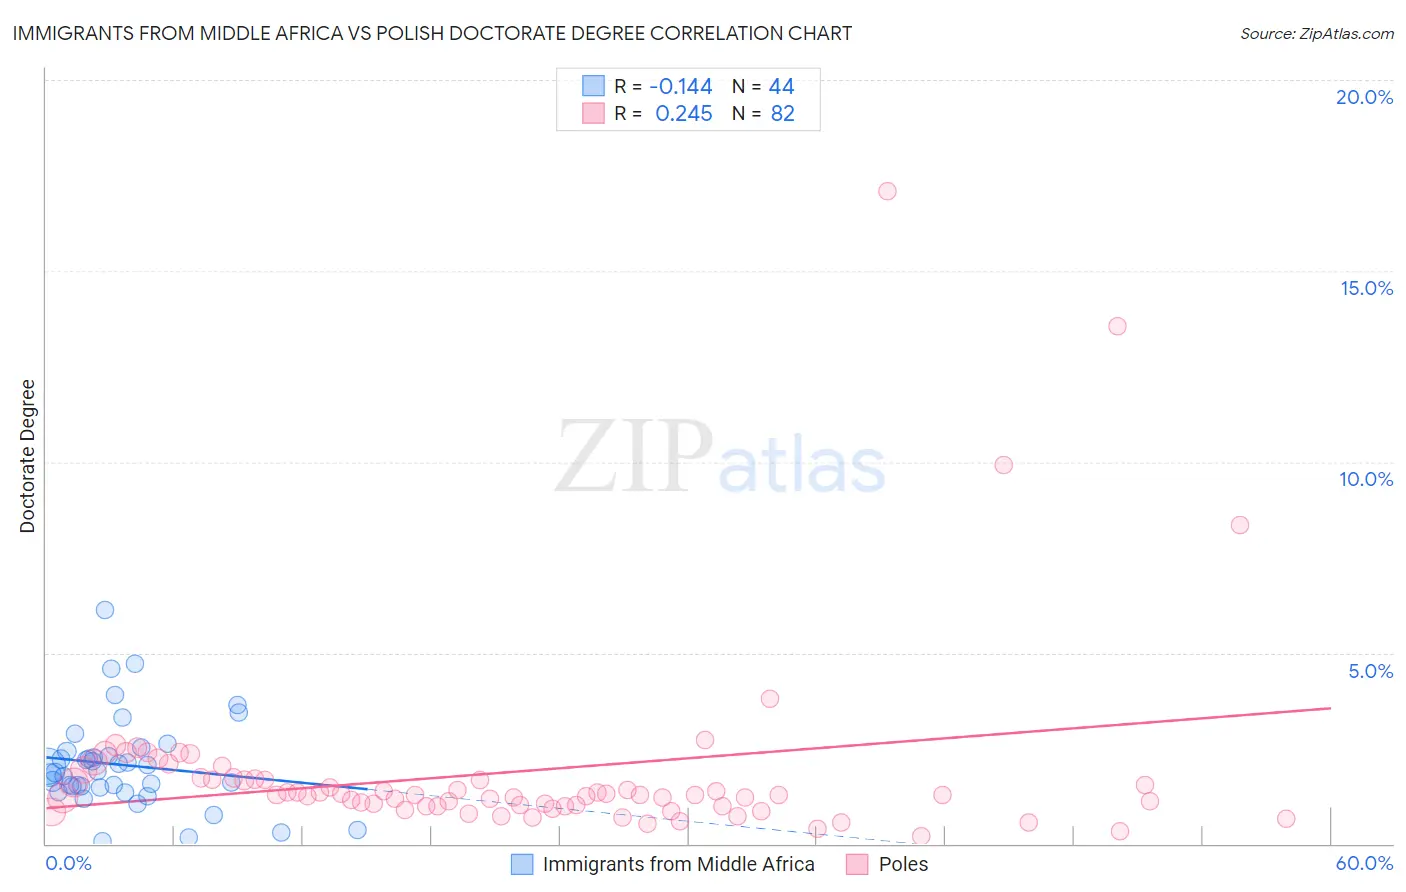
Immigrants from Middle Africa vs Polish Doctorate Degree Correlation Chart
The statistical analysis conducted on geographies consisting of 202,038,624 people shows a poor negative correlation between the proportion of Immigrants from Middle Africa and percentage of population with at least doctorate degree education in the United States with a correlation coefficient (R) of -0.144 and weighted average of 1.9%. Similarly, the statistical analysis conducted on geographies consisting of 539,143,774 people shows a weak positive correlation between the proportion of Poles and percentage of population with at least doctorate degree education in the United States with a correlation coefficient (R) of 0.245 and weighted average of 1.9%, a difference of 0.67%.
Doctorate Degree Correlation Summary
| Measurement | Immigrants from Middle Africa | Polish |
| Minimum | 0.076% | 0.20% |
| Maximum | 6.1% | 17.1% |
| Range | 6.0% | 16.9% |
| Mean | 2.1% | 1.9% |
| Median | 1.9% | 1.3% |
| Interquartile 25% (IQ1) | 1.5% | 0.98% |
| Interquartile 75% (IQ3) | 2.4% | 1.7% |
| Interquartile Range (IQR) | 0.87% | 0.71% |
| Standard Deviation (Sample) | 1.2% | 2.5% |
| Standard Deviation (Population) | 1.2% | 2.5% |
Demographics Similar to Immigrants from Middle Africa and Poles by Doctorate Degree
In terms of doctorate degree, the demographic groups most similar to Immigrants from Middle Africa are Welsh (1.9%, a difference of 0.15%), Irish (1.9%, a difference of 0.21%), Slovene (1.9%, a difference of 0.24%), Czech (1.9%, a difference of 0.25%), and Celtic (1.9%, a difference of 0.35%). Similarly, the demographic groups most similar to Poles are Immigrants from Albania (1.9%, a difference of 0.020%), Slavic (1.9%, a difference of 0.060%), Danish (1.9%, a difference of 0.14%), Hungarian (1.9%, a difference of 0.17%), and Immigrants from Oceania (1.9%, a difference of 0.24%).
| Demographics | Rating | Rank | Doctorate Degree |
| Luxembourgers | 81.1 /100 | #148 | Excellent 1.9% |
| Basques | 76.9 /100 | #149 | Good 1.9% |
| English | 75.9 /100 | #150 | Good 1.9% |
| Albanians | 74.8 /100 | #151 | Good 1.9% |
| Immigrants | Kenya | 74.3 /100 | #152 | Good 1.9% |
| Immigrants | Oceania | 74.0 /100 | #153 | Good 1.9% |
| Immigrants | Albania | 72.8 /100 | #154 | Good 1.9% |
| Poles | 72.7 /100 | #155 | Good 1.9% |
| Slavs | 72.4 /100 | #156 | Good 1.9% |
| Danes | 71.9 /100 | #157 | Good 1.9% |
| Hungarians | 71.7 /100 | #158 | Good 1.9% |
| Slovenes | 70.2 /100 | #159 | Good 1.9% |
| Welsh | 69.7 /100 | #160 | Good 1.9% |
| Immigrants | Middle Africa | 68.8 /100 | #161 | Good 1.9% |
| Irish | 67.5 /100 | #162 | Good 1.9% |
| Czechs | 67.3 /100 | #163 | Good 1.9% |
| Celtics | 66.7 /100 | #164 | Good 1.9% |
| Scotch-Irish | 63.6 /100 | #165 | Good 1.9% |
| Spaniards | 63.5 /100 | #166 | Good 1.9% |
| Macedonians | 60.9 /100 | #167 | Good 1.9% |
| Sri Lankans | 60.3 /100 | #168 | Good 1.9% |