Immigrants from Mexico vs Comanche Seniors Poverty Over the Age of 75
COMPARE
Immigrants from Mexico
Comanche
Seniors Poverty Over the Age of 75
Seniors Poverty Over the Age of 75 Comparison
Immigrants from Mexico
Comanche
14.9%
SENIORS POVERTY OVER THE AGE OF 75
0.0/ 100
METRIC RATING
285th/ 347
METRIC RANK
12.8%
SENIORS POVERTY OVER THE AGE OF 75
7.0/ 100
METRIC RATING
210th/ 347
METRIC RANK
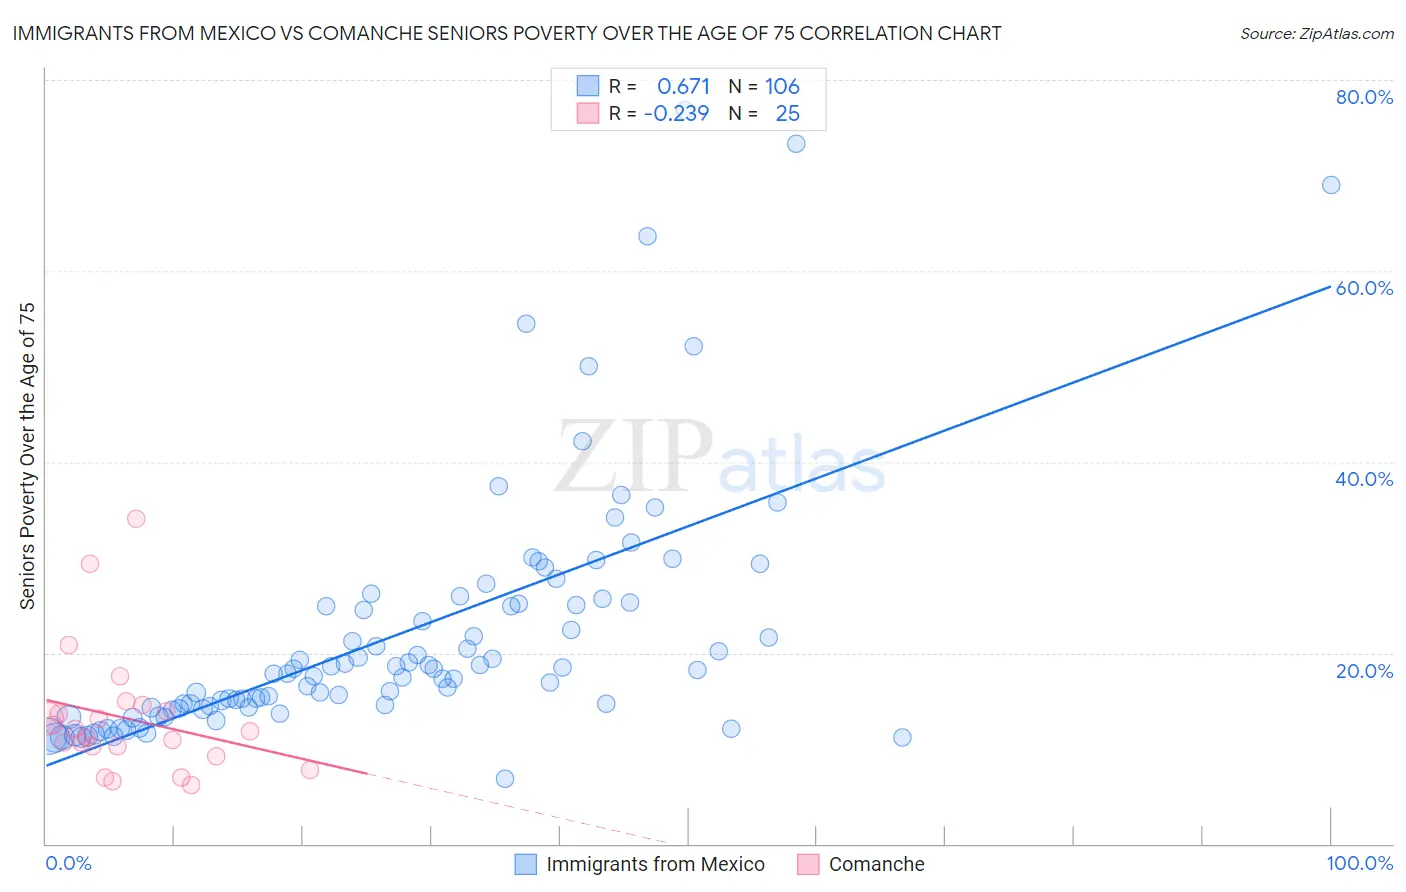
Immigrants from Mexico vs Comanche Seniors Poverty Over the Age of 75 Correlation Chart
The statistical analysis conducted on geographies consisting of 503,324,088 people shows a significant positive correlation between the proportion of Immigrants from Mexico and poverty level among seniors over the age of 75 in the United States with a correlation coefficient (R) of 0.671 and weighted average of 14.9%. Similarly, the statistical analysis conducted on geographies consisting of 109,150,338 people shows a weak negative correlation between the proportion of Comanche and poverty level among seniors over the age of 75 in the United States with a correlation coefficient (R) of -0.239 and weighted average of 12.8%, a difference of 16.3%.
Seniors Poverty Over the Age of 75 Correlation Summary
| Measurement | Immigrants from Mexico | Comanche |
| Minimum | 6.8% | 6.1% |
| Maximum | 76.9% | 34.0% |
| Range | 70.1% | 27.9% |
| Mean | 21.9% | 13.1% |
| Median | 18.0% | 11.8% |
| Interquartile 25% (IQ1) | 14.2% | 9.7% |
| Interquartile 75% (IQ3) | 25.1% | 14.2% |
| Interquartile Range (IQR) | 10.9% | 4.5% |
| Standard Deviation (Sample) | 13.1% | 6.6% |
| Standard Deviation (Population) | 13.1% | 6.4% |
Similar Demographics by Seniors Poverty Over the Age of 75
Demographics Similar to Immigrants from Mexico by Seniors Poverty Over the Age of 75
In terms of seniors poverty over the age of 75, the demographic groups most similar to Immigrants from Mexico are Cheyenne (14.9%, a difference of 0.19%), Immigrants from Central America (15.0%, a difference of 0.33%), Guatemalan (14.8%, a difference of 0.83%), Immigrants from Senegal (14.8%, a difference of 0.89%), and Immigrants from Guatemala (15.1%, a difference of 0.93%).
| Demographics | Rating | Rank | Seniors Poverty Over the Age of 75 |
| Immigrants | Colombia | 0.0 /100 | #278 | Tragic 14.6% |
| Blacks/African Americans | 0.0 /100 | #279 | Tragic 14.6% |
| Central Americans | 0.0 /100 | #280 | Tragic 14.7% |
| Belizeans | 0.0 /100 | #281 | Tragic 14.8% |
| Immigrants | Senegal | 0.0 /100 | #282 | Tragic 14.8% |
| Guatemalans | 0.0 /100 | #283 | Tragic 14.8% |
| Cheyenne | 0.0 /100 | #284 | Tragic 14.9% |
| Immigrants | Mexico | 0.0 /100 | #285 | Tragic 14.9% |
| Immigrants | Central America | 0.0 /100 | #286 | Tragic 15.0% |
| Immigrants | Guatemala | 0.0 /100 | #287 | Tragic 15.1% |
| Jamaicans | 0.0 /100 | #288 | Tragic 15.1% |
| Immigrants | Belize | 0.0 /100 | #289 | Tragic 15.2% |
| Immigrants | Azores | 0.0 /100 | #290 | Tragic 15.2% |
| Paiute | 0.0 /100 | #291 | Tragic 15.2% |
| Colville | 0.0 /100 | #292 | Tragic 15.2% |
Demographics Similar to Comanche by Seniors Poverty Over the Age of 75
In terms of seniors poverty over the age of 75, the demographic groups most similar to Comanche are Brazilian (12.8%, a difference of 0.020%), Immigrants from Liberia (12.8%, a difference of 0.10%), Immigrants from Hong Kong (12.8%, a difference of 0.15%), French American Indian (12.9%, a difference of 0.30%), and Immigrants from Africa (12.9%, a difference of 0.37%).
| Demographics | Rating | Rank | Seniors Poverty Over the Age of 75 |
| Immigrants | Southern Europe | 10.7 /100 | #203 | Poor 12.7% |
| Immigrants | Eritrea | 10.5 /100 | #204 | Poor 12.7% |
| Indians (Asian) | 9.7 /100 | #205 | Tragic 12.7% |
| Albanians | 9.6 /100 | #206 | Tragic 12.7% |
| Costa Ricans | 8.7 /100 | #207 | Tragic 12.8% |
| Immigrants | Eastern Asia | 8.4 /100 | #208 | Tragic 12.8% |
| Immigrants | Liberia | 7.3 /100 | #209 | Tragic 12.8% |
| Comanche | 7.0 /100 | #210 | Tragic 12.8% |
| Brazilians | 6.9 /100 | #211 | Tragic 12.8% |
| Immigrants | Hong Kong | 6.5 /100 | #212 | Tragic 12.8% |
| French American Indians | 6.1 /100 | #213 | Tragic 12.9% |
| Immigrants | Africa | 5.9 /100 | #214 | Tragic 12.9% |
| South American Indians | 5.5 /100 | #215 | Tragic 12.9% |
| Immigrants | Brazil | 5.2 /100 | #216 | Tragic 12.9% |
| Bermudans | 4.9 /100 | #217 | Tragic 12.9% |