Immigrants from Mexico vs Immigrants from Asia Disability Age 5 to 17

COMPARE

Immigrants from Mexico
Race
Ancestry
AfghanAfricanAlaska NativeAlaskan AthabascanAlbanianAleutAlsatianAmericanApacheArabArapahoArgentineanArmenianAssyrian/Chaldean/SyriacAustralianAustrianBahamianBangladeshiBarbadianBasqueBelgianBelizeanBermudanBhutaneseBlackfeetBolivianBrazilianBritishBritish West IndianBulgarianBurmeseCajunCambodianCanadianCape VerdeanCarpatho RusynCelticCentral AmericanCentral American IndianCherokeeCheyenneChickasawChileanChineseChippewaChoctawColombianColvilleComancheCosta RicanCreeCreekCroatianCrowCubanCypriotCzechCzechoslovakianDanishDelawareDominicanDutchDutch West IndianEastern EuropeanEcuadorianEgyptianEnglishEstonianEthiopianEuropeanFijianFilipinoFinnishFrenchFrench American IndianFrench CanadianGermanGerman RussianGhanaianGreekGuamanian/ChamorroGuatemalanGuyaneseHaitianHmongHonduranHopiHoumaHungarianIcelanderIndian (Asian)IndonesianInupiatIranianIraqiIrishIroquoisIsraeliItalianJamaicanJapaneseJordanianKenyanKiowaKoreanLaotianLatvianLebaneseLiberianLithuanianLumbeeLuxembourgerMacedonianMalaysianMalteseMarshalleseMenomineeMexicanMexican American IndianMongolianMoroccanNative HawaiianNavajoNepaleseNew ZealanderNicaraguanNigerianNorthern EuropeanNorwegianOkinawanOsageOttawaPaiutePakistaniPalestinianPanamanianParaguayanPennsylvania GermanPeruvianPimaPolishPortuguesePotawatomiPuebloPuerto RicanPuget Sound SalishRomanianRussianSalvadoranSamoanScandinavianScotch-IrishScottishSeminoleSenegaleseSerbianShoshoneSierra LeoneanSiouxSlavicSlovakSloveneSomaliSouth AfricanSouth AmericanSouth American IndianSoviet UnionSpaniardSpanishSpanish AmericanSpanish American IndianSri LankanSubsaharan AfricanSudaneseSwedishSwissSyrianTaiwaneseThaiTlingit-HaidaTohono O'OdhamTonganTrinidadian and TobagonianTsimshianTurkishU.S. Virgin IslanderUgandanUkrainianUruguayanUteVenezuelanVietnameseWelshWest IndianYakamaYaquiYugoslavianYumanYup'ikZimbabwean
Immigration
NonimmigrantsImmigrantsAfghanistanAfricaAlbaniaArgentinaArmeniaAustraliaAustriaBahamasBangladeshBarbadosBelarusBelgiumBelizeBoliviaBosnia and HerzegovinaBrazilBulgariaBurma/MyanmarCabo VerdeCambodiaCameroonCanadaCaribbeanCentral AmericaChileChinaColombiaCongoCosta RicaCroatiaCubaCzechoslovakiaDenmarkDominicaDominican RepublicEastern AfricaEastern AsiaEastern EuropeEcuadorEgyptEl SalvadorEnglandEritreaEthiopiaEuropeFijiFranceGermanyGhanaGreeceGrenadaGuatemalaGuyanaHaitiHondurasHong KongHungaryIndiaIndonesiaIranIraqIrelandIsraelItalyJamaicaJapanJordanKazakhstanKenyaKoreaKuwaitLaosLatin AmericaLatviaLebanonLiberiaLithuaniaMalaysiaMexicoMicronesiaMiddle AfricaMoldovaMoroccoNepalNetherlandsNicaraguaNigeriaNorth AmericaNorth MacedoniaNorthern AfricaNorthern EuropeNorwayOceaniaPakistanPanamaPeruPhilippinesPolandPortugalRomaniaRussiaSaudi ArabiaScotlandSenegalSerbiaSierra LeoneSingaporeSomaliaSouth AfricaSouth AmericaSouth Central AsiaSouth Eastern AsiaSouthern EuropeSpainSri LankaSt. Vincent and the GrenadinesSudanSwedenSwitzerlandSyriaTaiwanThailandTrinidad and TobagoTurkeyUgandaUkraineUruguayUzbekistanVenezuelaVietnamWest IndiesWestern AfricaWestern AsiaWestern EuropeYemenZaireZimbabweAzores
Immigrants from Asia
Race
Ancestry
AfghanAfricanAlaska NativeAlaskan AthabascanAlbanianAleutAlsatianAmericanApacheArabArapahoArgentineanArmenianAssyrian/Chaldean/SyriacAustralianAustrianBahamianBangladeshiBarbadianBasqueBelgianBelizeanBermudanBhutaneseBlackfeetBolivianBrazilianBritishBritish West IndianBulgarianBurmeseCajunCambodianCanadianCape VerdeanCarpatho RusynCelticCentral AmericanCentral American IndianCherokeeCheyenneChickasawChileanChineseChippewaChoctawColombianColvilleComancheCosta RicanCreeCreekCroatianCrowCubanCypriotCzechCzechoslovakianDanishDelawareDominicanDutchDutch West IndianEastern EuropeanEcuadorianEgyptianEnglishEstonianEthiopianEuropeanFijianFilipinoFinnishFrenchFrench American IndianFrench CanadianGermanGerman RussianGhanaianGreekGuamanian/ChamorroGuatemalanGuyaneseHaitianHmongHonduranHopiHoumaHungarianIcelanderIndian (Asian)IndonesianInupiatIranianIraqiIrishIroquoisIsraeliItalianJamaicanJapaneseJordanianKenyanKiowaKoreanLaotianLatvianLebaneseLiberianLithuanianLumbeeLuxembourgerMacedonianMalaysianMalteseMarshalleseMenomineeMexicanMexican American IndianMongolianMoroccanNative HawaiianNavajoNepaleseNew ZealanderNicaraguanNigerianNorthern EuropeanNorwegianOkinawanOsageOttawaPaiutePakistaniPalestinianPanamanianParaguayanPennsylvania GermanPeruvianPimaPolishPortuguesePotawatomiPuebloPuerto RicanPuget Sound SalishRomanianRussianSalvadoranSamoanScandinavianScotch-IrishScottishSeminoleSenegaleseSerbianShoshoneSierra LeoneanSiouxSlavicSlovakSloveneSomaliSouth AfricanSouth AmericanSouth American IndianSoviet UnionSpaniardSpanishSpanish AmericanSpanish American IndianSri LankanSubsaharan AfricanSudaneseSwedishSwissSyrianTaiwaneseThaiTlingit-HaidaTohono O'OdhamTonganTrinidadian and TobagonianTsimshianTurkishU.S. Virgin IslanderUgandanUkrainianUruguayanUteVenezuelanVietnameseWelshWest IndianYakamaYaquiYugoslavianYumanYup'ikZimbabwean
Immigration
NonimmigrantsImmigrantsAfghanistanAfricaAlbaniaArgentinaArmeniaAsiaAustraliaAustriaBahamasBangladeshBarbadosBelarusBelgiumBelizeBoliviaBosnia and HerzegovinaBrazilBulgariaBurma/MyanmarCabo VerdeCambodiaCameroonCanadaCaribbeanCentral AmericaChileChinaColombiaCongoCosta RicaCroatiaCubaCzechoslovakiaDenmarkDominicaDominican RepublicEastern AfricaEastern AsiaEastern EuropeEcuadorEgyptEl SalvadorEnglandEritreaEthiopiaEuropeFijiFranceGermanyGhanaGreeceGrenadaGuatemalaGuyanaHaitiHondurasHong KongHungaryIndiaIndonesiaIranIraqIrelandIsraelItalyJamaicaJapanJordanKazakhstanKenyaKoreaKuwaitLaosLatin AmericaLatviaLebanonLiberiaLithuaniaMalaysiaMicronesiaMiddle AfricaMoldovaMoroccoNepalNetherlandsNicaraguaNigeriaNorth AmericaNorth MacedoniaNorthern AfricaNorthern EuropeNorwayOceaniaPakistanPanamaPeruPhilippinesPolandPortugalRomaniaRussiaSaudi ArabiaScotlandSenegalSerbiaSierra LeoneSingaporeSomaliaSouth AfricaSouth AmericaSouth Central AsiaSouth Eastern AsiaSouthern EuropeSpainSri LankaSt. Vincent and the GrenadinesSudanSwedenSwitzerlandSyriaTaiwanThailandTrinidad and TobagoTurkeyUgandaUkraineUruguayUzbekistanVenezuelaVietnamWest IndiesWestern AfricaWestern AsiaWestern EuropeYemenZaireZimbabweAzores
Disability Age 5 to 17
Income
Poverty
Unemployment
Labor Participation
Family Structure
Vehicle Availability
Education Level
Disability

Disability Age 5 to 17 Comparison

Immigrants from Mexico

Immigrants from Asia

Fair
Exceptional
5.6%
DISABILITY AGE 5 TO 17
33.7/ 100
METRIC RATING
185th/ 347
METRIC RANK
4.8%
DISABILITY AGE 5 TO 17
100.0/ 100
METRIC RATING
25th/ 347
METRIC RANK

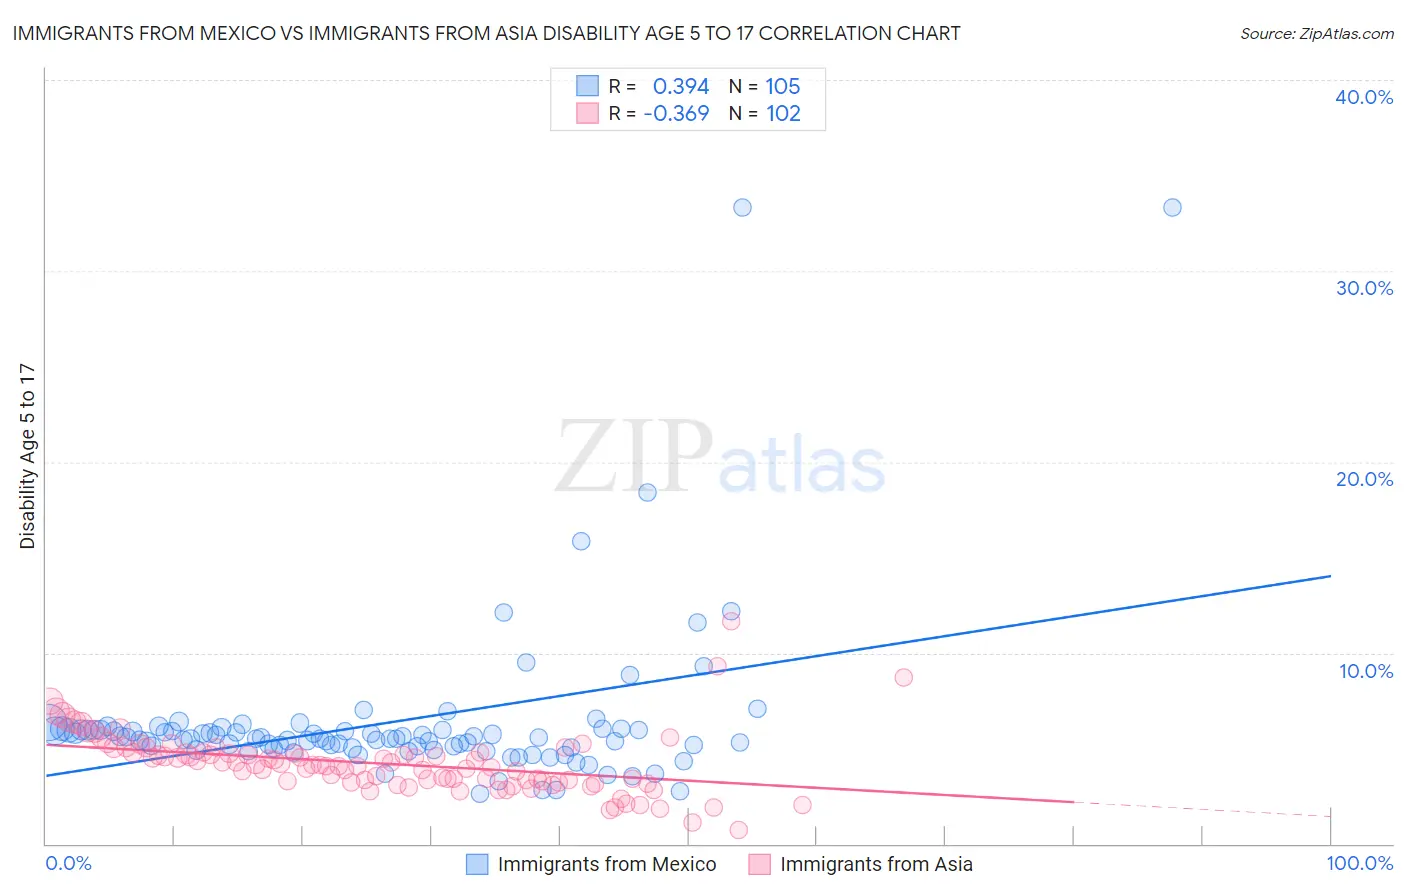
Immigrants from Mexico vs Immigrants from Asia Disability Age 5 to 17 Correlation Chart

The statistical analysis conducted on geographies consisting of 506,254,859 people shows a mild positive correlation between the proportion of Immigrants from Mexico and percentage of population with a disability between the ages 5 and 17 in the United States with a correlation coefficient (R) of 0.394 and weighted average of 5.6%. Similarly, the statistical analysis conducted on geographies consisting of 539,214,409 people shows a mild negative correlation between the proportion of Immigrants from Asia and percentage of population with a disability between the ages 5 and 17 in the United States with a correlation coefficient (R) of -0.369 and weighted average of 4.8%, a difference of 16.4%.
Immigrants from Mexico vs Immigrants from Asia Disability Age 5 to 17

Disability Age 5 to 17 Correlation Summary

MeasurementImmigrants from MexicoImmigrants from Asia
Minimum2.6%0.75%
Maximum33.3%11.7%
Range30.7%10.9%
Mean6.4%4.2%
Median5.5%4.1%
Interquartile 25% (IQ1)5.0%3.3%
Interquartile 75% (IQ3)6.0%4.8%
Interquartile Range (IQR)0.96%1.5%
Standard Deviation (Sample)4.4%1.6%
Standard Deviation (Population)4.4%1.6%

Similar Demographics by Disability Age 5 to 17

Demographics Similar to Immigrants from Mexico by Disability Age 5 to 17

In terms of disability age 5 to 17, the demographic groups most similar to Immigrants from Mexico are Syrian (5.6%, a difference of 0.010%), Immigrants from Latin America (5.6%, a difference of 0.030%), Mexican American Indian (5.6%, a difference of 0.080%), Fijian (5.7%, a difference of 0.11%), and Immigrants from England (5.6%, a difference of 0.14%).
DemographicsRating | RankDisability Age 5 to 17
Immigrants | Trinidad and Tobago
47.6
/100
|
#178
Average
5.6%
Immigrants | Barbados
40.5
/100
|
#179
Average
5.6%
Immigrants | Uruguay
37.7
/100
|
#180
Fair
5.6%
Immigrants | England
36.4
/100
|
#181
Fair
5.6%
Mexican American Indians
35.2
/100
|
#182
Fair
5.6%
Immigrants | Latin America
34.3
/100
|
#183
Fair
5.6%
Syrians
33.8
/100
|
#184
Fair
5.6%
Immigrants | Mexico
33.7
/100
|
#185
Fair
5.6%
Fijians
31.7
/100
|
#186
Fair
5.7%
Immigrants | Thailand
30.2
/100
|
#187
Fair
5.7%
Marshallese
28.1
/100
|
#188
Fair
5.7%
Pueblo
27.5
/100
|
#189
Fair
5.7%
Immigrants | Eastern Africa
27.3
/100
|
#190
Fair
5.7%
Danes
26.5
/100
|
#191
Fair
5.7%
Immigrants | Bosnia and Herzegovina
26.3
/100
|
#192
Fair
5.7%

Demographics Similar to Immigrants from Asia by Disability Age 5 to 17

In terms of disability age 5 to 17, the demographic groups most similar to Immigrants from Asia are Immigrants from Lebanon (4.8%, a difference of 0.11%), Immigrants from Bolivia (4.8%, a difference of 0.26%), Bhutanese (4.9%, a difference of 0.87%), Asian (4.8%, a difference of 0.92%), and Yup'ik (4.8%, a difference of 1.3%).
DemographicsRating | RankDisability Age 5 to 17
Immigrants | South Central Asia
100.0
/100
|
#18
Exceptional
4.7%
Immigrants | Uzbekistan
100.0
/100
|
#19
Exceptional
4.8%
Burmese
100.0
/100
|
#20
Exceptional
4.8%
Yup'ik
100.0
/100
|
#21
Exceptional
4.8%
Asians
100.0
/100
|
#22
Exceptional
4.8%
Immigrants | Bolivia
100.0
/100
|
#23
Exceptional
4.8%
Immigrants | Lebanon
100.0
/100
|
#24
Exceptional
4.8%
Immigrants | Asia
100.0
/100
|
#25
Exceptional
4.8%
Bhutanese
100.0
/100
|
#26
Exceptional
4.9%
Taiwanese
100.0
/100
|
#27
Exceptional
4.9%
Immigrants | Japan
100.0
/100
|
#28
Exceptional
4.9%
Immigrants | Serbia
100.0
/100
|
#29
Exceptional
4.9%
Immigrants | Malaysia
100.0
/100
|
#30
Exceptional
5.0%
Immigrants | Pakistan
100.0
/100
|
#31
Exceptional
5.0%
Soviet Union
100.0
/100
|
#32
Exceptional
5.0%