Immigrants from Dominican Republic vs Immigrants from Kenya Self-Care Disability
COMPARE
Immigrants from Dominican Republic
Immigrants from Kenya
Self-Care Disability
Self-Care Disability Comparison
Immigrants from Dominican Republic
Immigrants from Kenya
3.0%
SELF-CARE DISABILITY
0.0/ 100
METRIC RATING
339th/ 347
METRIC RANK
2.3%
SELF-CARE DISABILITY
99.0/ 100
METRIC RATING
79th/ 347
METRIC RANK
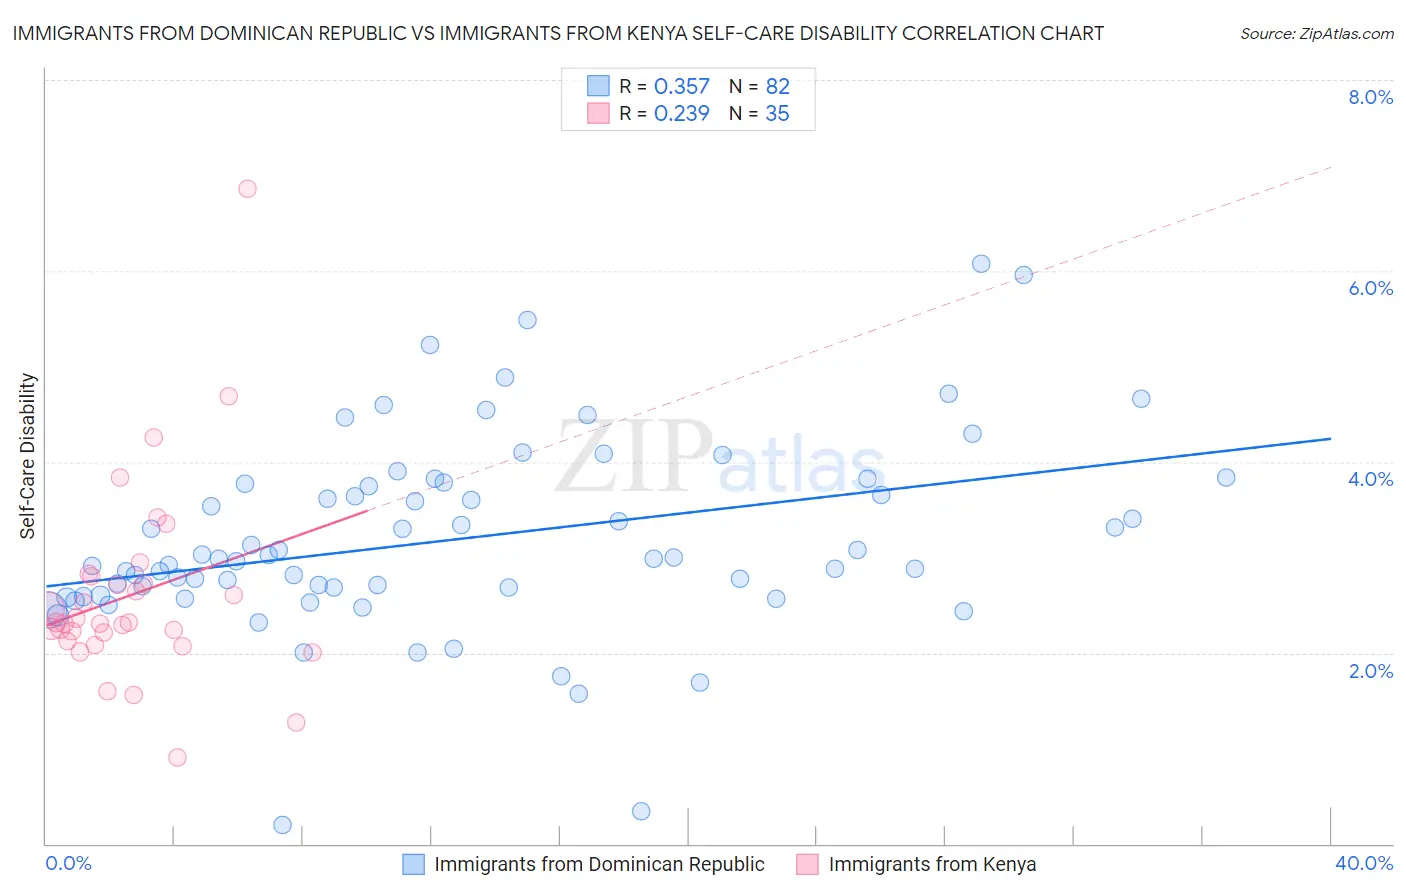
Immigrants from Dominican Republic vs Immigrants from Kenya Self-Care Disability Correlation Chart
The statistical analysis conducted on geographies consisting of 274,850,038 people shows a mild positive correlation between the proportion of Immigrants from Dominican Republic and percentage of population with self-care disability in the United States with a correlation coefficient (R) of 0.357 and weighted average of 3.0%. Similarly, the statistical analysis conducted on geographies consisting of 217,918,601 people shows a weak positive correlation between the proportion of Immigrants from Kenya and percentage of population with self-care disability in the United States with a correlation coefficient (R) of 0.239 and weighted average of 2.3%, a difference of 30.6%.
Self-Care Disability Correlation Summary
| Measurement | Immigrants from Dominican Republic | Immigrants from Kenya |
| Minimum | 0.19% | 0.90% |
| Maximum | 6.1% | 6.9% |
| Range | 5.9% | 6.0% |
| Mean | 3.2% | 2.6% |
| Median | 3.0% | 2.3% |
| Interquartile 25% (IQ1) | 2.6% | 2.1% |
| Interquartile 75% (IQ3) | 3.8% | 2.8% |
| Interquartile Range (IQR) | 1.2% | 0.68% |
| Standard Deviation (Sample) | 1.0% | 1.1% |
| Standard Deviation (Population) | 1.0% | 1.0% |
Similar Demographics by Self-Care Disability
Demographics Similar to Immigrants from Dominican Republic by Self-Care Disability
In terms of self-care disability, the demographic groups most similar to Immigrants from Dominican Republic are Immigrants from Cabo Verde (3.1%, a difference of 0.33%), Cape Verdean (3.0%, a difference of 0.38%), Dominican (3.1%, a difference of 0.59%), Choctaw (3.0%, a difference of 0.69%), and Immigrants from Yemen (3.0%, a difference of 1.8%).
| Demographics | Rating | Rank | Self-Care Disability |
| Kiowa | 0.0 /100 | #332 | Tragic 3.0% |
| Dutch West Indians | 0.0 /100 | #333 | Tragic 3.0% |
| Houma | 0.0 /100 | #334 | Tragic 3.0% |
| Immigrants | Azores | 0.0 /100 | #335 | Tragic 3.0% |
| Immigrants | Yemen | 0.0 /100 | #336 | Tragic 3.0% |
| Choctaw | 0.0 /100 | #337 | Tragic 3.0% |
| Cape Verdeans | 0.0 /100 | #338 | Tragic 3.0% |
| Immigrants | Dominican Republic | 0.0 /100 | #339 | Tragic 3.0% |
| Immigrants | Cabo Verde | 0.0 /100 | #340 | Tragic 3.1% |
| Dominicans | 0.0 /100 | #341 | Tragic 3.1% |
| Colville | 0.0 /100 | #342 | Tragic 3.1% |
| Tohono O'odham | 0.0 /100 | #343 | Tragic 3.1% |
| Pueblo | 0.0 /100 | #344 | Tragic 3.3% |
| Armenians | 0.0 /100 | #345 | Tragic 3.4% |
| Puerto Ricans | 0.0 /100 | #346 | Tragic 3.7% |
Demographics Similar to Immigrants from Kenya by Self-Care Disability
In terms of self-care disability, the demographic groups most similar to Immigrants from Kenya are Immigrants from Middle Africa (2.3%, a difference of 0.010%), Immigrants from Ireland (2.3%, a difference of 0.010%), Immigrants from China (2.3%, a difference of 0.090%), Immigrants from Netherlands (2.3%, a difference of 0.10%), and Immigrants from Switzerland (2.3%, a difference of 0.14%).
| Demographics | Rating | Rank | Self-Care Disability |
| Eastern Europeans | 99.2 /100 | #72 | Exceptional 2.3% |
| Immigrants | Egypt | 99.1 /100 | #73 | Exceptional 2.3% |
| Immigrants | Switzerland | 99.1 /100 | #74 | Exceptional 2.3% |
| Immigrants | Netherlands | 99.1 /100 | #75 | Exceptional 2.3% |
| Immigrants | China | 99.1 /100 | #76 | Exceptional 2.3% |
| Immigrants | Middle Africa | 99.0 /100 | #77 | Exceptional 2.3% |
| Immigrants | Ireland | 99.0 /100 | #78 | Exceptional 2.3% |
| Immigrants | Kenya | 99.0 /100 | #79 | Exceptional 2.3% |
| Chileans | 98.8 /100 | #80 | Exceptional 2.3% |
| Ugandans | 98.8 /100 | #81 | Exceptional 2.3% |
| Immigrants | Denmark | 98.8 /100 | #82 | Exceptional 2.3% |
| Indians (Asian) | 98.7 /100 | #83 | Exceptional 2.3% |
| Immigrants | Spain | 98.7 /100 | #84 | Exceptional 2.3% |
| Estonians | 98.3 /100 | #85 | Exceptional 2.3% |
| Immigrants | Northern Africa | 98.2 /100 | #86 | Exceptional 2.3% |