Hispanic or Latino vs Immigrants from Kenya Self-Care Disability
COMPARE
Hispanic or Latino
Immigrants from Kenya
Self-Care Disability
Self-Care Disability Comparison
Hispanics or Latinos
Immigrants from Kenya
2.7%
SELF-CARE DISABILITY
0.1/ 100
METRIC RATING
280th/ 347
METRIC RANK
2.3%
SELF-CARE DISABILITY
99.0/ 100
METRIC RATING
79th/ 347
METRIC RANK
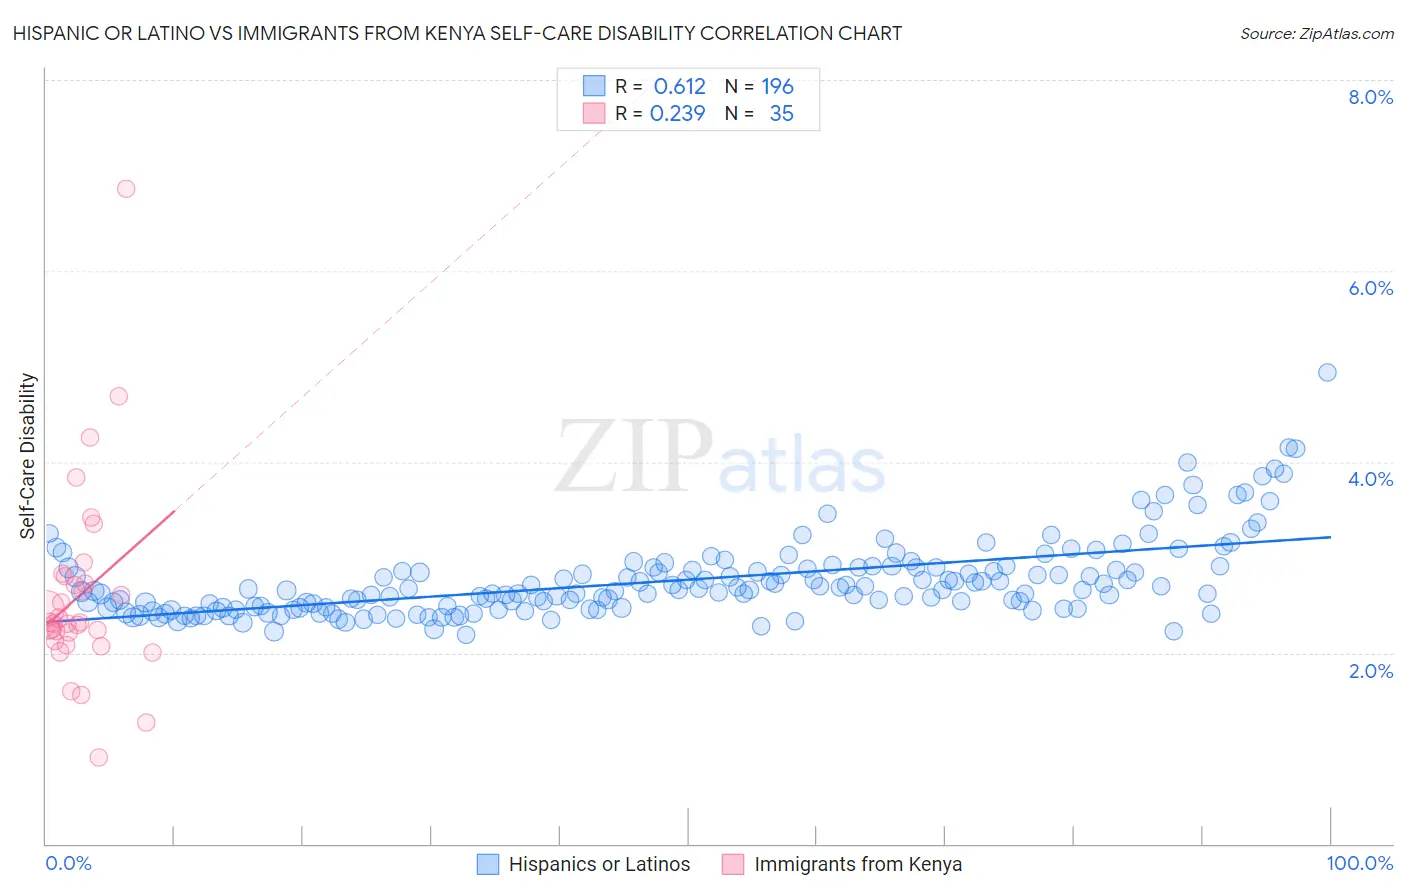
Hispanic or Latino vs Immigrants from Kenya Self-Care Disability Correlation Chart
The statistical analysis conducted on geographies consisting of 571,452,222 people shows a significant positive correlation between the proportion of Hispanics or Latinos and percentage of population with self-care disability in the United States with a correlation coefficient (R) of 0.612 and weighted average of 2.7%. Similarly, the statistical analysis conducted on geographies consisting of 217,918,601 people shows a weak positive correlation between the proportion of Immigrants from Kenya and percentage of population with self-care disability in the United States with a correlation coefficient (R) of 0.239 and weighted average of 2.3%, a difference of 15.3%.
Self-Care Disability Correlation Summary
| Measurement | Hispanic or Latino | Immigrants from Kenya |
| Minimum | 2.2% | 0.90% |
| Maximum | 4.9% | 6.9% |
| Range | 2.8% | 6.0% |
| Mean | 2.8% | 2.6% |
| Median | 2.7% | 2.3% |
| Interquartile 25% (IQ1) | 2.5% | 2.1% |
| Interquartile 75% (IQ3) | 2.9% | 2.8% |
| Interquartile Range (IQR) | 0.42% | 0.68% |
| Standard Deviation (Sample) | 0.41% | 1.1% |
| Standard Deviation (Population) | 0.41% | 1.0% |
Similar Demographics by Self-Care Disability
Demographics Similar to Hispanics or Latinos by Self-Care Disability
In terms of self-care disability, the demographic groups most similar to Hispanics or Latinos are Iroquois (2.7%, a difference of 0.020%), Ottawa (2.7%, a difference of 0.12%), Immigrants from Iraq (2.7%, a difference of 0.16%), Apache (2.7%, a difference of 0.17%), and Immigrants from Ukraine (2.7%, a difference of 0.20%).
| Demographics | Rating | Rank | Self-Care Disability |
| Mexicans | 0.1 /100 | #273 | Tragic 2.7% |
| Yakama | 0.1 /100 | #274 | Tragic 2.7% |
| Immigrants | Trinidad and Tobago | 0.1 /100 | #275 | Tragic 2.7% |
| Japanese | 0.1 /100 | #276 | Tragic 2.7% |
| Immigrants | Ukraine | 0.1 /100 | #277 | Tragic 2.7% |
| Ottawa | 0.1 /100 | #278 | Tragic 2.7% |
| Iroquois | 0.1 /100 | #279 | Tragic 2.7% |
| Hispanics or Latinos | 0.1 /100 | #280 | Tragic 2.7% |
| Immigrants | Iraq | 0.0 /100 | #281 | Tragic 2.7% |
| Apache | 0.0 /100 | #282 | Tragic 2.7% |
| Delaware | 0.0 /100 | #283 | Tragic 2.7% |
| Fijians | 0.0 /100 | #284 | Tragic 2.7% |
| Jamaicans | 0.0 /100 | #285 | Tragic 2.7% |
| French American Indians | 0.0 /100 | #286 | Tragic 2.7% |
| Immigrants | Jamaica | 0.0 /100 | #287 | Tragic 2.7% |
Demographics Similar to Immigrants from Kenya by Self-Care Disability
In terms of self-care disability, the demographic groups most similar to Immigrants from Kenya are Immigrants from Middle Africa (2.3%, a difference of 0.010%), Immigrants from Ireland (2.3%, a difference of 0.010%), Immigrants from China (2.3%, a difference of 0.090%), Immigrants from Netherlands (2.3%, a difference of 0.10%), and Immigrants from Switzerland (2.3%, a difference of 0.14%).
| Demographics | Rating | Rank | Self-Care Disability |
| Eastern Europeans | 99.2 /100 | #72 | Exceptional 2.3% |
| Immigrants | Egypt | 99.1 /100 | #73 | Exceptional 2.3% |
| Immigrants | Switzerland | 99.1 /100 | #74 | Exceptional 2.3% |
| Immigrants | Netherlands | 99.1 /100 | #75 | Exceptional 2.3% |
| Immigrants | China | 99.1 /100 | #76 | Exceptional 2.3% |
| Immigrants | Middle Africa | 99.0 /100 | #77 | Exceptional 2.3% |
| Immigrants | Ireland | 99.0 /100 | #78 | Exceptional 2.3% |
| Immigrants | Kenya | 99.0 /100 | #79 | Exceptional 2.3% |
| Chileans | 98.8 /100 | #80 | Exceptional 2.3% |
| Ugandans | 98.8 /100 | #81 | Exceptional 2.3% |
| Immigrants | Denmark | 98.8 /100 | #82 | Exceptional 2.3% |
| Indians (Asian) | 98.7 /100 | #83 | Exceptional 2.3% |
| Immigrants | Spain | 98.7 /100 | #84 | Exceptional 2.3% |
| Estonians | 98.3 /100 | #85 | Exceptional 2.3% |
| Immigrants | Northern Africa | 98.2 /100 | #86 | Exceptional 2.3% |