Immigrants from Latvia vs White/Caucasian Vision Disability
COMPARE
Immigrants from Latvia
White/Caucasian
Vision Disability
Vision Disability Comparison
Immigrants from Latvia
Whites/Caucasians
2.0%
VISION DISABILITY
97.3/ 100
METRIC RATING
84th/ 347
METRIC RANK
2.4%
VISION DISABILITY
0.2/ 100
METRIC RATING
259th/ 347
METRIC RANK
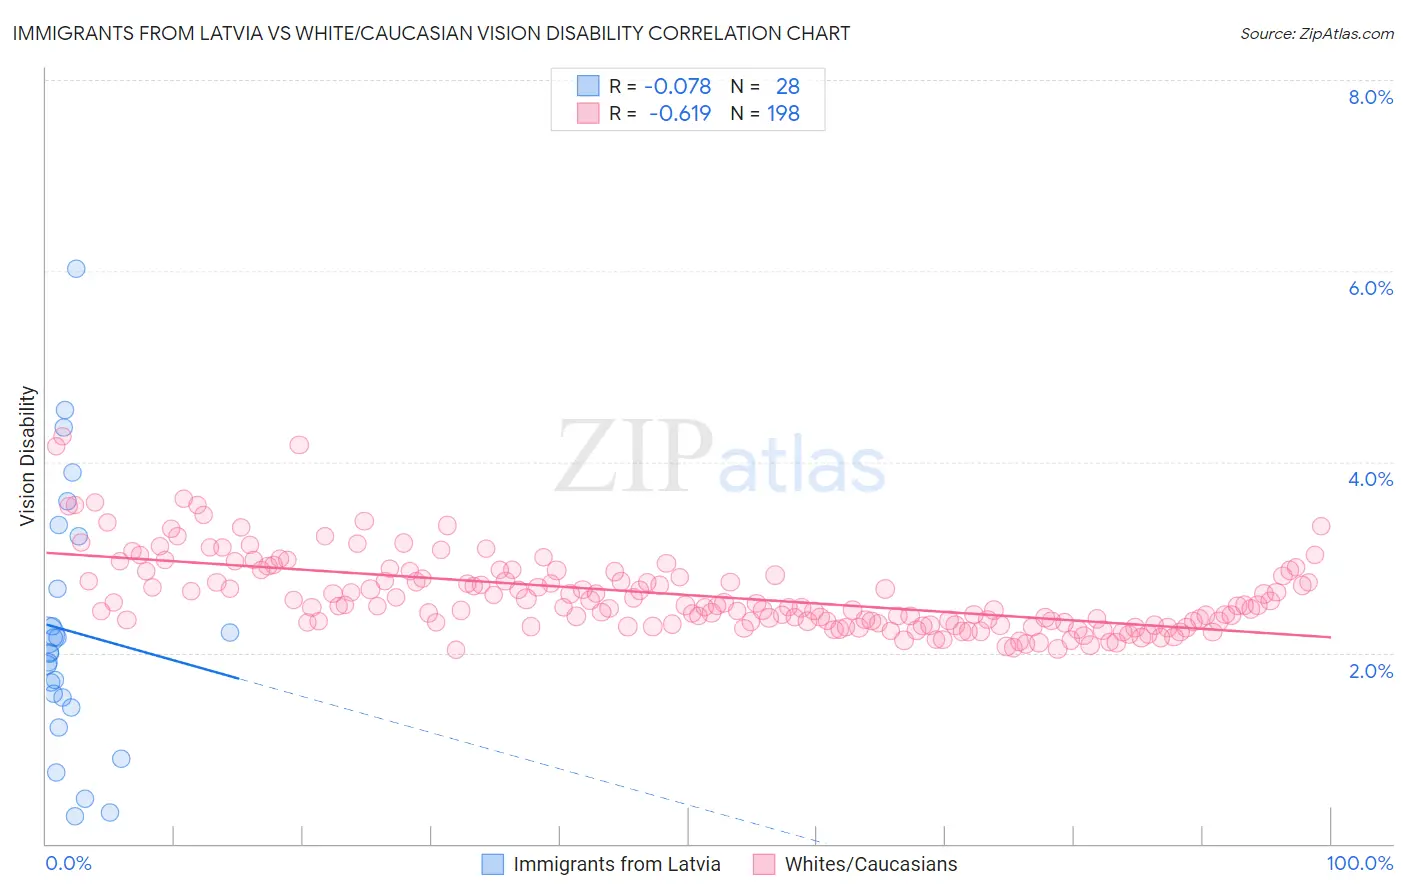
Immigrants from Latvia vs White/Caucasian Vision Disability Correlation Chart
The statistical analysis conducted on geographies consisting of 113,721,440 people shows a slight negative correlation between the proportion of Immigrants from Latvia and percentage of population with vision disability in the United States with a correlation coefficient (R) of -0.078 and weighted average of 2.0%. Similarly, the statistical analysis conducted on geographies consisting of 580,529,348 people shows a significant negative correlation between the proportion of Whites/Caucasians and percentage of population with vision disability in the United States with a correlation coefficient (R) of -0.619 and weighted average of 2.4%, a difference of 16.4%.
Vision Disability Correlation Summary
| Measurement | Immigrants from Latvia | White/Caucasian |
| Minimum | 0.29% | 2.0% |
| Maximum | 6.0% | 4.3% |
| Range | 5.7% | 2.2% |
| Mean | 2.2% | 2.6% |
| Median | 2.0% | 2.5% |
| Interquartile 25% (IQ1) | 1.5% | 2.3% |
| Interquartile 75% (IQ3) | 3.0% | 2.8% |
| Interquartile Range (IQR) | 1.5% | 0.50% |
| Standard Deviation (Sample) | 1.4% | 0.41% |
| Standard Deviation (Population) | 1.3% | 0.41% |
Similar Demographics by Vision Disability
Demographics Similar to Immigrants from Latvia by Vision Disability
In terms of vision disability, the demographic groups most similar to Immigrants from Latvia are Chinese (2.0%, a difference of 0.060%), Immigrants from Moldova (2.0%, a difference of 0.080%), Immigrants from Western Asia (2.0%, a difference of 0.12%), Immigrants from Switzerland (2.0%, a difference of 0.14%), and Norwegian (2.0%, a difference of 0.15%).
| Demographics | Rating | Rank | Vision Disability |
| Immigrants | Jordan | 98.3 /100 | #77 | Exceptional 2.0% |
| Immigrants | Eastern Europe | 98.3 /100 | #78 | Exceptional 2.0% |
| Assyrians/Chaldeans/Syriacs | 98.1 /100 | #79 | Exceptional 2.0% |
| Lithuanians | 97.7 /100 | #80 | Exceptional 2.0% |
| Soviet Union | 97.6 /100 | #81 | Exceptional 2.0% |
| Immigrants | Poland | 97.6 /100 | #82 | Exceptional 2.0% |
| Immigrants | Western Asia | 97.5 /100 | #83 | Exceptional 2.0% |
| Immigrants | Latvia | 97.3 /100 | #84 | Exceptional 2.0% |
| Chinese | 97.2 /100 | #85 | Exceptional 2.0% |
| Immigrants | Moldova | 97.2 /100 | #86 | Exceptional 2.0% |
| Immigrants | Switzerland | 97.0 /100 | #87 | Exceptional 2.0% |
| Norwegians | 97.0 /100 | #88 | Exceptional 2.0% |
| Immigrants | Eastern Africa | 97.0 /100 | #89 | Exceptional 2.0% |
| Immigrants | Lebanon | 96.7 /100 | #90 | Exceptional 2.1% |
| Immigrants | Somalia | 96.2 /100 | #91 | Exceptional 2.1% |
Demographics Similar to Whites/Caucasians by Vision Disability
In terms of vision disability, the demographic groups most similar to Whites/Caucasians are British West Indian (2.4%, a difference of 0.010%), West Indian (2.4%, a difference of 0.040%), Immigrants from Haiti (2.4%, a difference of 0.12%), Belizean (2.4%, a difference of 0.17%), and Fijian (2.4%, a difference of 0.38%).
| Demographics | Rating | Rank | Vision Disability |
| Immigrants | Micronesia | 0.3 /100 | #252 | Tragic 2.4% |
| Japanese | 0.3 /100 | #253 | Tragic 2.4% |
| Haitians | 0.3 /100 | #254 | Tragic 2.4% |
| Immigrants | Guatemala | 0.3 /100 | #255 | Tragic 2.4% |
| Immigrants | Haiti | 0.2 /100 | #256 | Tragic 2.4% |
| West Indians | 0.2 /100 | #257 | Tragic 2.4% |
| British West Indians | 0.2 /100 | #258 | Tragic 2.4% |
| Whites/Caucasians | 0.2 /100 | #259 | Tragic 2.4% |
| Belizeans | 0.2 /100 | #260 | Tragic 2.4% |
| Fijians | 0.1 /100 | #261 | Tragic 2.4% |
| Jamaicans | 0.1 /100 | #262 | Tragic 2.4% |
| Immigrants | Belize | 0.1 /100 | #263 | Tragic 2.4% |
| Immigrants | Liberia | 0.1 /100 | #264 | Tragic 2.4% |
| Immigrants | Jamaica | 0.1 /100 | #265 | Tragic 2.4% |
| Mexican American Indians | 0.1 /100 | #266 | Tragic 2.4% |