Immigrants from Sudan vs White/Caucasian Vision Disability
COMPARE
Immigrants from Sudan
White/Caucasian
Vision Disability
Vision Disability Comparison
Immigrants from Sudan
Whites/Caucasians
2.1%
VISION DISABILITY
78.4/ 100
METRIC RATING
147th/ 347
METRIC RANK
2.4%
VISION DISABILITY
0.2/ 100
METRIC RATING
259th/ 347
METRIC RANK
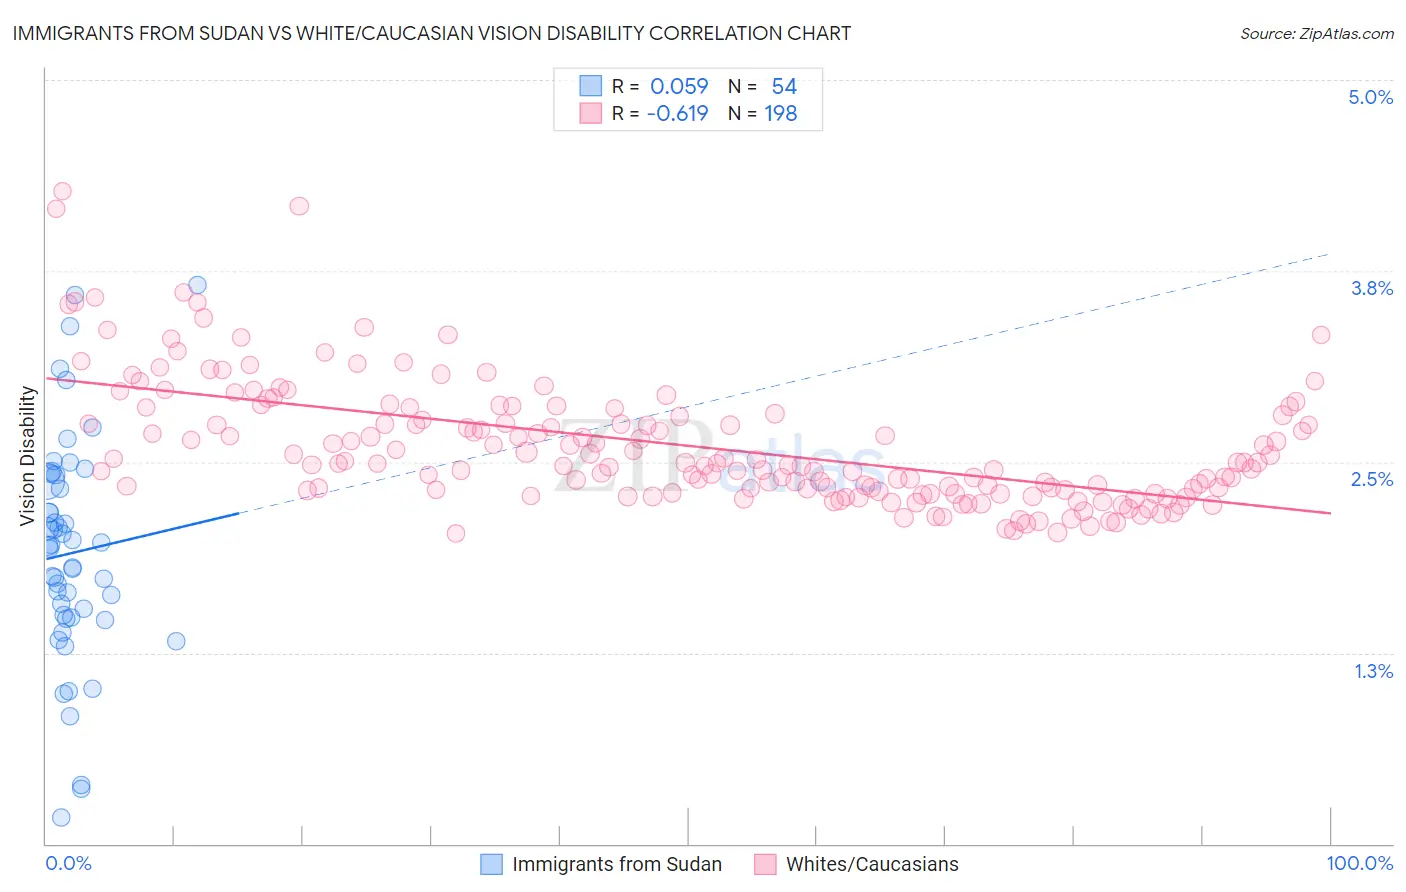
Immigrants from Sudan vs White/Caucasian Vision Disability Correlation Chart
The statistical analysis conducted on geographies consisting of 118,945,827 people shows a slight positive correlation between the proportion of Immigrants from Sudan and percentage of population with vision disability in the United States with a correlation coefficient (R) of 0.059 and weighted average of 2.1%. Similarly, the statistical analysis conducted on geographies consisting of 580,529,348 people shows a significant negative correlation between the proportion of Whites/Caucasians and percentage of population with vision disability in the United States with a correlation coefficient (R) of -0.619 and weighted average of 2.4%, a difference of 12.1%.
Vision Disability Correlation Summary
| Measurement | Immigrants from Sudan | White/Caucasian |
| Minimum | 0.17% | 2.0% |
| Maximum | 3.7% | 4.3% |
| Range | 3.5% | 2.2% |
| Mean | 1.9% | 2.6% |
| Median | 1.9% | 2.5% |
| Interquartile 25% (IQ1) | 1.5% | 2.3% |
| Interquartile 75% (IQ3) | 2.4% | 2.8% |
| Interquartile Range (IQR) | 0.90% | 0.50% |
| Standard Deviation (Sample) | 0.73% | 0.41% |
| Standard Deviation (Population) | 0.73% | 0.41% |
Similar Demographics by Vision Disability
Demographics Similar to Immigrants from Sudan by Vision Disability
In terms of vision disability, the demographic groups most similar to Immigrants from Sudan are Finnish (2.1%, a difference of 0.010%), Italian (2.1%, a difference of 0.13%), Colombian (2.1%, a difference of 0.20%), Belgian (2.1%, a difference of 0.23%), and Immigrants from Norway (2.1%, a difference of 0.26%).
| Demographics | Rating | Rank | Vision Disability |
| Immigrants | Netherlands | 84.2 /100 | #140 | Excellent 2.1% |
| Sierra Leoneans | 84.1 /100 | #141 | Excellent 2.1% |
| South Americans | 82.8 /100 | #142 | Excellent 2.1% |
| Immigrants | Sierra Leone | 82.8 /100 | #143 | Excellent 2.1% |
| Ukrainians | 81.9 /100 | #144 | Excellent 2.1% |
| Immigrants | Bosnia and Herzegovina | 81.5 /100 | #145 | Excellent 2.1% |
| Italians | 79.7 /100 | #146 | Good 2.1% |
| Immigrants | Sudan | 78.4 /100 | #147 | Good 2.1% |
| Finns | 78.3 /100 | #148 | Good 2.1% |
| Colombians | 76.2 /100 | #149 | Good 2.1% |
| Belgians | 75.9 /100 | #150 | Good 2.1% |
| Immigrants | Norway | 75.5 /100 | #151 | Good 2.1% |
| Immigrants | Southern Europe | 74.6 /100 | #152 | Good 2.1% |
| Immigrants | South America | 73.8 /100 | #153 | Good 2.1% |
| Slovenes | 73.6 /100 | #154 | Good 2.1% |
Demographics Similar to Whites/Caucasians by Vision Disability
In terms of vision disability, the demographic groups most similar to Whites/Caucasians are British West Indian (2.4%, a difference of 0.010%), West Indian (2.4%, a difference of 0.040%), Immigrants from Haiti (2.4%, a difference of 0.12%), Belizean (2.4%, a difference of 0.17%), and Fijian (2.4%, a difference of 0.38%).
| Demographics | Rating | Rank | Vision Disability |
| Immigrants | Micronesia | 0.3 /100 | #252 | Tragic 2.4% |
| Japanese | 0.3 /100 | #253 | Tragic 2.4% |
| Haitians | 0.3 /100 | #254 | Tragic 2.4% |
| Immigrants | Guatemala | 0.3 /100 | #255 | Tragic 2.4% |
| Immigrants | Haiti | 0.2 /100 | #256 | Tragic 2.4% |
| West Indians | 0.2 /100 | #257 | Tragic 2.4% |
| British West Indians | 0.2 /100 | #258 | Tragic 2.4% |
| Whites/Caucasians | 0.2 /100 | #259 | Tragic 2.4% |
| Belizeans | 0.2 /100 | #260 | Tragic 2.4% |
| Fijians | 0.1 /100 | #261 | Tragic 2.4% |
| Jamaicans | 0.1 /100 | #262 | Tragic 2.4% |
| Immigrants | Belize | 0.1 /100 | #263 | Tragic 2.4% |
| Immigrants | Liberia | 0.1 /100 | #264 | Tragic 2.4% |
| Immigrants | Jamaica | 0.1 /100 | #265 | Tragic 2.4% |
| Mexican American Indians | 0.1 /100 | #266 | Tragic 2.4% |