Immigrants from Latvia vs Immigrants from Eastern Africa Vision Disability
COMPARE
Immigrants from Latvia
Immigrants from Eastern Africa
Vision Disability
Vision Disability Comparison
Immigrants from Latvia
Immigrants from Eastern Africa
2.0%
VISION DISABILITY
97.3/ 100
METRIC RATING
84th/ 347
METRIC RANK
2.0%
VISION DISABILITY
97.0/ 100
METRIC RATING
89th/ 347
METRIC RANK
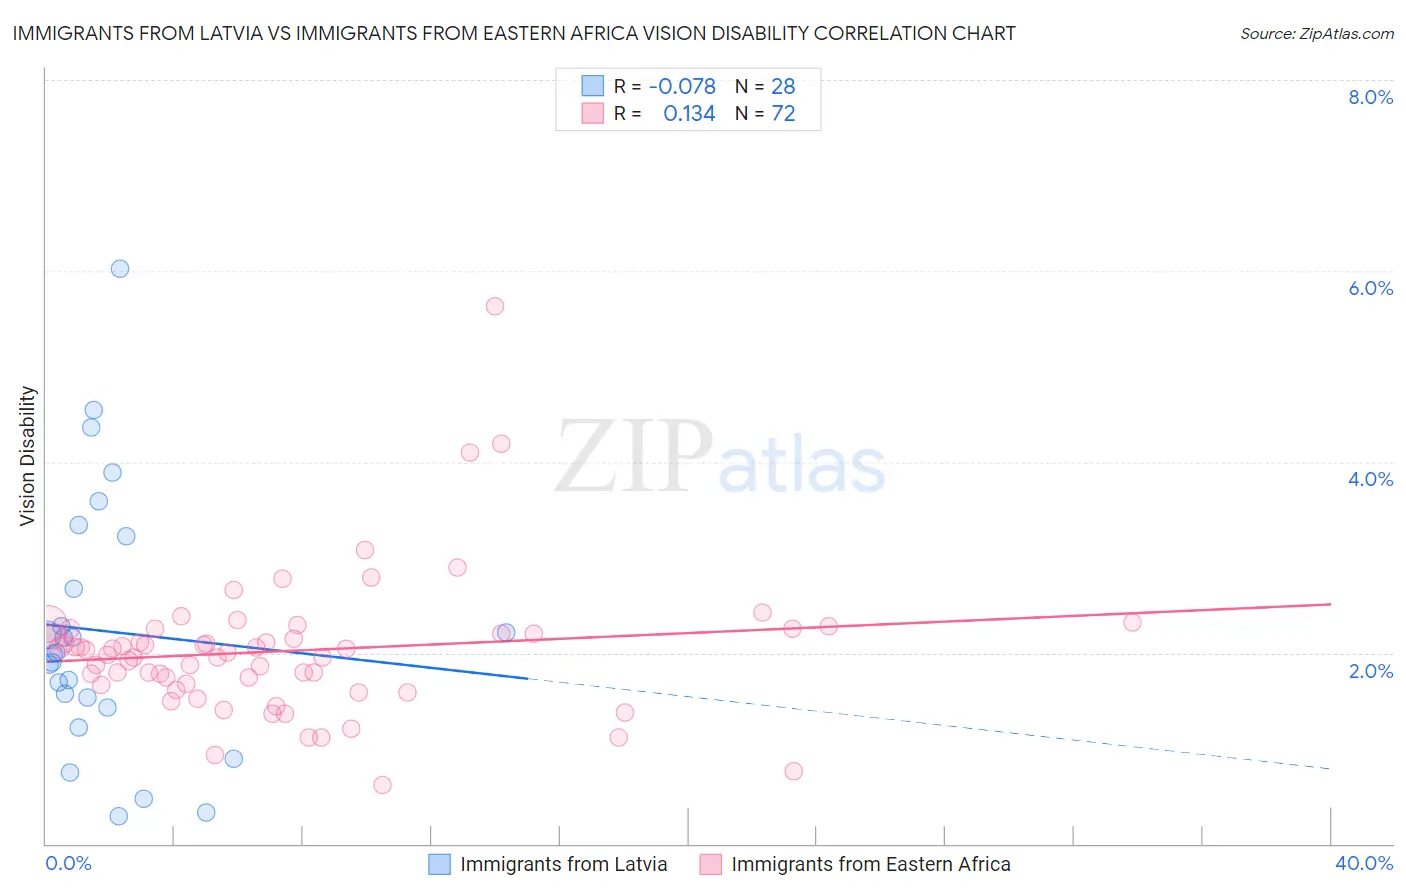
Immigrants from Latvia vs Immigrants from Eastern Africa Vision Disability Correlation Chart
The statistical analysis conducted on geographies consisting of 113,721,440 people shows a slight negative correlation between the proportion of Immigrants from Latvia and percentage of population with vision disability in the United States with a correlation coefficient (R) of -0.078 and weighted average of 2.0%. Similarly, the statistical analysis conducted on geographies consisting of 354,920,232 people shows a poor positive correlation between the proportion of Immigrants from Eastern Africa and percentage of population with vision disability in the United States with a correlation coefficient (R) of 0.134 and weighted average of 2.0%, a difference of 0.20%.
Vision Disability Correlation Summary
| Measurement | Immigrants from Latvia | Immigrants from Eastern Africa |
| Minimum | 0.29% | 0.61% |
| Maximum | 6.0% | 5.6% |
| Range | 5.7% | 5.0% |
| Mean | 2.2% | 2.0% |
| Median | 2.0% | 2.0% |
| Interquartile 25% (IQ1) | 1.5% | 1.7% |
| Interquartile 75% (IQ3) | 3.0% | 2.2% |
| Interquartile Range (IQR) | 1.5% | 0.55% |
| Standard Deviation (Sample) | 1.4% | 0.73% |
| Standard Deviation (Population) | 1.3% | 0.73% |
Demographics Similar to Immigrants from Latvia and Immigrants from Eastern Africa by Vision Disability
In terms of vision disability, the demographic groups most similar to Immigrants from Latvia are Chinese (2.0%, a difference of 0.060%), Immigrants from Moldova (2.0%, a difference of 0.080%), Immigrants from Western Asia (2.0%, a difference of 0.12%), Immigrants from Switzerland (2.0%, a difference of 0.14%), and Norwegian (2.0%, a difference of 0.15%). Similarly, the demographic groups most similar to Immigrants from Eastern Africa are Norwegian (2.0%, a difference of 0.040%), Immigrants from Switzerland (2.0%, a difference of 0.050%), Immigrants from Moldova (2.0%, a difference of 0.11%), Chinese (2.0%, a difference of 0.14%), and Immigrants from Lebanon (2.1%, a difference of 0.14%).
| Demographics | Rating | Rank | Vision Disability |
| Paraguayans | 98.3 /100 | #76 | Exceptional 2.0% |
| Immigrants | Jordan | 98.3 /100 | #77 | Exceptional 2.0% |
| Immigrants | Eastern Europe | 98.3 /100 | #78 | Exceptional 2.0% |
| Assyrians/Chaldeans/Syriacs | 98.1 /100 | #79 | Exceptional 2.0% |
| Lithuanians | 97.7 /100 | #80 | Exceptional 2.0% |
| Soviet Union | 97.6 /100 | #81 | Exceptional 2.0% |
| Immigrants | Poland | 97.6 /100 | #82 | Exceptional 2.0% |
| Immigrants | Western Asia | 97.5 /100 | #83 | Exceptional 2.0% |
| Immigrants | Latvia | 97.3 /100 | #84 | Exceptional 2.0% |
| Chinese | 97.2 /100 | #85 | Exceptional 2.0% |
| Immigrants | Moldova | 97.2 /100 | #86 | Exceptional 2.0% |
| Immigrants | Switzerland | 97.0 /100 | #87 | Exceptional 2.0% |
| Norwegians | 97.0 /100 | #88 | Exceptional 2.0% |
| Immigrants | Eastern Africa | 97.0 /100 | #89 | Exceptional 2.0% |
| Immigrants | Lebanon | 96.7 /100 | #90 | Exceptional 2.1% |
| Immigrants | Somalia | 96.2 /100 | #91 | Exceptional 2.1% |
| Immigrants | Syria | 96.2 /100 | #92 | Exceptional 2.1% |
| Immigrants | Europe | 96.1 /100 | #93 | Exceptional 2.1% |
| Immigrants | Croatia | 96.0 /100 | #94 | Exceptional 2.1% |
| Australians | 95.9 /100 | #95 | Exceptional 2.1% |
| Romanians | 95.7 /100 | #96 | Exceptional 2.1% |