Immigrants from Latvia vs Nigerian Vision Disability
COMPARE
Immigrants from Latvia
Nigerian
Vision Disability
Vision Disability Comparison
Immigrants from Latvia
Nigerians
2.0%
VISION DISABILITY
97.3/ 100
METRIC RATING
84th/ 347
METRIC RANK
2.3%
VISION DISABILITY
7.2/ 100
METRIC RATING
215th/ 347
METRIC RANK
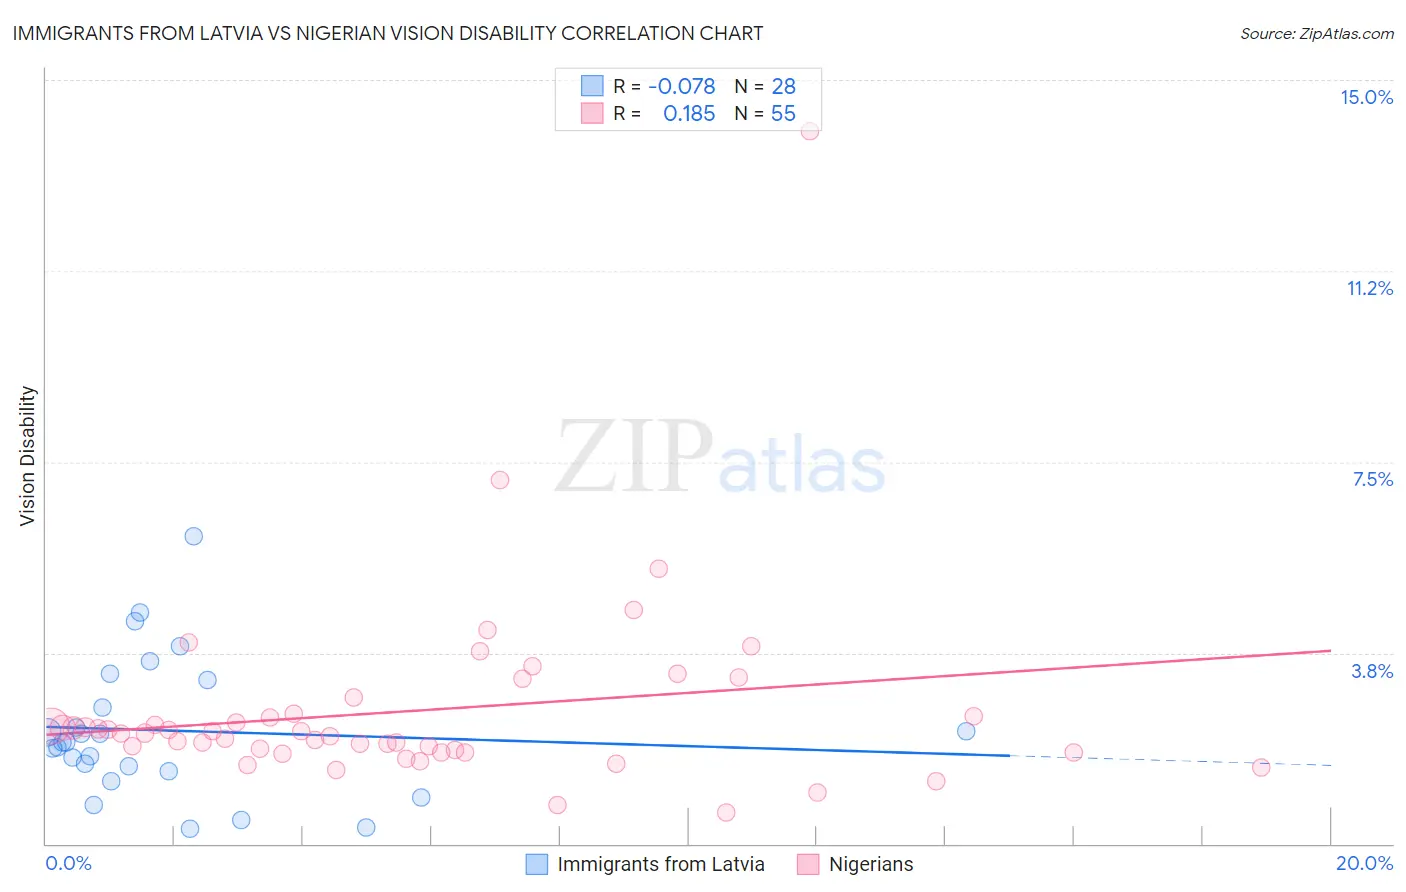
Immigrants from Latvia vs Nigerian Vision Disability Correlation Chart
The statistical analysis conducted on geographies consisting of 113,721,440 people shows a slight negative correlation between the proportion of Immigrants from Latvia and percentage of population with vision disability in the United States with a correlation coefficient (R) of -0.078 and weighted average of 2.0%. Similarly, the statistical analysis conducted on geographies consisting of 332,578,519 people shows a poor positive correlation between the proportion of Nigerians and percentage of population with vision disability in the United States with a correlation coefficient (R) of 0.185 and weighted average of 2.3%, a difference of 10.2%.
Vision Disability Correlation Summary
| Measurement | Immigrants from Latvia | Nigerian |
| Minimum | 0.29% | 0.62% |
| Maximum | 6.0% | 14.0% |
| Range | 5.7% | 13.4% |
| Mean | 2.2% | 2.6% |
| Median | 2.0% | 2.2% |
| Interquartile 25% (IQ1) | 1.5% | 1.8% |
| Interquartile 75% (IQ3) | 3.0% | 2.5% |
| Interquartile Range (IQR) | 1.5% | 0.74% |
| Standard Deviation (Sample) | 1.4% | 1.9% |
| Standard Deviation (Population) | 1.3% | 1.9% |
Similar Demographics by Vision Disability
Demographics Similar to Immigrants from Latvia by Vision Disability
In terms of vision disability, the demographic groups most similar to Immigrants from Latvia are Chinese (2.0%, a difference of 0.060%), Immigrants from Moldova (2.0%, a difference of 0.080%), Immigrants from Western Asia (2.0%, a difference of 0.12%), Immigrants from Switzerland (2.0%, a difference of 0.14%), and Norwegian (2.0%, a difference of 0.15%).
| Demographics | Rating | Rank | Vision Disability |
| Immigrants | Jordan | 98.3 /100 | #77 | Exceptional 2.0% |
| Immigrants | Eastern Europe | 98.3 /100 | #78 | Exceptional 2.0% |
| Assyrians/Chaldeans/Syriacs | 98.1 /100 | #79 | Exceptional 2.0% |
| Lithuanians | 97.7 /100 | #80 | Exceptional 2.0% |
| Soviet Union | 97.6 /100 | #81 | Exceptional 2.0% |
| Immigrants | Poland | 97.6 /100 | #82 | Exceptional 2.0% |
| Immigrants | Western Asia | 97.5 /100 | #83 | Exceptional 2.0% |
| Immigrants | Latvia | 97.3 /100 | #84 | Exceptional 2.0% |
| Chinese | 97.2 /100 | #85 | Exceptional 2.0% |
| Immigrants | Moldova | 97.2 /100 | #86 | Exceptional 2.0% |
| Immigrants | Switzerland | 97.0 /100 | #87 | Exceptional 2.0% |
| Norwegians | 97.0 /100 | #88 | Exceptional 2.0% |
| Immigrants | Eastern Africa | 97.0 /100 | #89 | Exceptional 2.0% |
| Immigrants | Lebanon | 96.7 /100 | #90 | Exceptional 2.1% |
| Immigrants | Somalia | 96.2 /100 | #91 | Exceptional 2.1% |
Demographics Similar to Nigerians by Vision Disability
In terms of vision disability, the demographic groups most similar to Nigerians are Trinidadian and Tobagonian (2.2%, a difference of 0.21%), Immigrants from Trinidad and Tobago (2.3%, a difference of 0.29%), Immigrants from Ghana (2.2%, a difference of 0.34%), Bermudan (2.2%, a difference of 0.35%), and Indonesian (2.2%, a difference of 0.44%).
| Demographics | Rating | Rank | Vision Disability |
| Germans | 13.4 /100 | #208 | Poor 2.2% |
| Immigrants | Brazil | 13.1 /100 | #209 | Poor 2.2% |
| Immigrants | Uruguay | 11.5 /100 | #210 | Poor 2.2% |
| Indonesians | 9.5 /100 | #211 | Tragic 2.2% |
| Bermudans | 9.0 /100 | #212 | Tragic 2.2% |
| Immigrants | Ghana | 8.9 /100 | #213 | Tragic 2.2% |
| Trinidadians and Tobagonians | 8.2 /100 | #214 | Tragic 2.2% |
| Nigerians | 7.2 /100 | #215 | Tragic 2.3% |
| Immigrants | Trinidad and Tobago | 6.1 /100 | #216 | Tragic 2.3% |
| Barbadians | 5.1 /100 | #217 | Tragic 2.3% |
| Portuguese | 4.9 /100 | #218 | Tragic 2.3% |
| Ecuadorians | 4.6 /100 | #219 | Tragic 2.3% |
| Guamanians/Chamorros | 3.9 /100 | #220 | Tragic 2.3% |
| French Canadians | 3.9 /100 | #221 | Tragic 2.3% |
| Immigrants | Senegal | 3.8 /100 | #222 | Tragic 2.3% |