Immigrants vs White/Caucasian Vision Disability
COMPARE
Immigrants
White/Caucasian
Vision Disability
Vision Disability Comparison
Immigrants
Whites/Caucasians
2.2%
VISION DISABILITY
23.7/ 100
METRIC RATING
195th/ 347
METRIC RANK
2.4%
VISION DISABILITY
0.2/ 100
METRIC RATING
259th/ 347
METRIC RANK
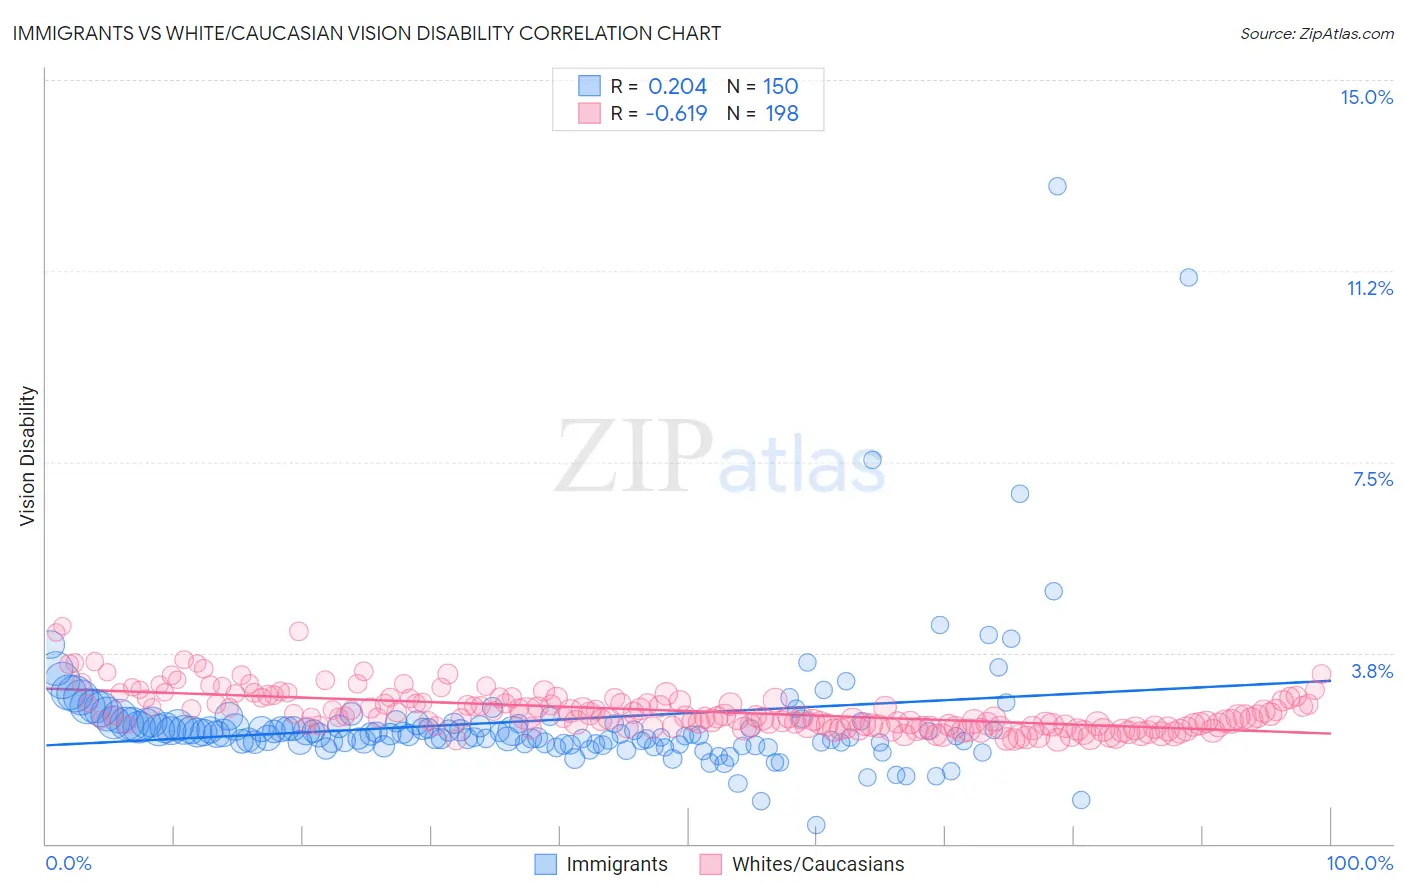
Immigrants vs White/Caucasian Vision Disability Correlation Chart
The statistical analysis conducted on geographies consisting of 575,432,160 people shows a weak positive correlation between the proportion of Immigrants and percentage of population with vision disability in the United States with a correlation coefficient (R) of 0.204 and weighted average of 2.2%. Similarly, the statistical analysis conducted on geographies consisting of 580,529,348 people shows a significant negative correlation between the proportion of Whites/Caucasians and percentage of population with vision disability in the United States with a correlation coefficient (R) of -0.619 and weighted average of 2.4%, a difference of 7.8%.
Vision Disability Correlation Summary
| Measurement | Immigrants | White/Caucasian |
| Minimum | 0.37% | 2.0% |
| Maximum | 12.9% | 4.3% |
| Range | 12.5% | 2.2% |
| Mean | 2.4% | 2.6% |
| Median | 2.2% | 2.5% |
| Interquartile 25% (IQ1) | 2.0% | 2.3% |
| Interquartile 75% (IQ3) | 2.4% | 2.8% |
| Interquartile Range (IQR) | 0.38% | 0.50% |
| Standard Deviation (Sample) | 1.4% | 0.41% |
| Standard Deviation (Population) | 1.4% | 0.41% |
Similar Demographics by Vision Disability
Demographics Similar to Immigrants by Vision Disability
In terms of vision disability, the demographic groups most similar to Immigrants are Immigrants from Barbados (2.2%, a difference of 0.020%), Immigrants from Grenada (2.2%, a difference of 0.050%), British (2.2%, a difference of 0.11%), Canadian (2.2%, a difference of 0.17%), and European (2.2%, a difference of 0.17%).
| Demographics | Rating | Rank | Vision Disability |
| Guyanese | 28.9 /100 | #188 | Fair 2.2% |
| Salvadorans | 27.4 /100 | #189 | Fair 2.2% |
| Immigrants | Costa Rica | 26.1 /100 | #190 | Fair 2.2% |
| Canadians | 25.8 /100 | #191 | Fair 2.2% |
| Europeans | 25.7 /100 | #192 | Fair 2.2% |
| British | 25.1 /100 | #193 | Fair 2.2% |
| Immigrants | Barbados | 24.0 /100 | #194 | Fair 2.2% |
| Immigrants | Immigrants | 23.7 /100 | #195 | Fair 2.2% |
| Immigrants | Grenada | 23.1 /100 | #196 | Fair 2.2% |
| Ghanaians | 21.8 /100 | #197 | Fair 2.2% |
| Czechoslovakians | 21.6 /100 | #198 | Fair 2.2% |
| Immigrants | El Salvador | 21.0 /100 | #199 | Fair 2.2% |
| Immigrants | Thailand | 20.1 /100 | #200 | Fair 2.2% |
| Slovaks | 18.8 /100 | #201 | Poor 2.2% |
| Immigrants | Zaire | 18.0 /100 | #202 | Poor 2.2% |
Demographics Similar to Whites/Caucasians by Vision Disability
In terms of vision disability, the demographic groups most similar to Whites/Caucasians are British West Indian (2.4%, a difference of 0.010%), West Indian (2.4%, a difference of 0.040%), Immigrants from Haiti (2.4%, a difference of 0.12%), Belizean (2.4%, a difference of 0.17%), and Fijian (2.4%, a difference of 0.38%).
| Demographics | Rating | Rank | Vision Disability |
| Immigrants | Micronesia | 0.3 /100 | #252 | Tragic 2.4% |
| Japanese | 0.3 /100 | #253 | Tragic 2.4% |
| Haitians | 0.3 /100 | #254 | Tragic 2.4% |
| Immigrants | Guatemala | 0.3 /100 | #255 | Tragic 2.4% |
| Immigrants | Haiti | 0.2 /100 | #256 | Tragic 2.4% |
| West Indians | 0.2 /100 | #257 | Tragic 2.4% |
| British West Indians | 0.2 /100 | #258 | Tragic 2.4% |
| Whites/Caucasians | 0.2 /100 | #259 | Tragic 2.4% |
| Belizeans | 0.2 /100 | #260 | Tragic 2.4% |
| Fijians | 0.1 /100 | #261 | Tragic 2.4% |
| Jamaicans | 0.1 /100 | #262 | Tragic 2.4% |
| Immigrants | Belize | 0.1 /100 | #263 | Tragic 2.4% |
| Immigrants | Liberia | 0.1 /100 | #264 | Tragic 2.4% |
| Immigrants | Jamaica | 0.1 /100 | #265 | Tragic 2.4% |
| Mexican American Indians | 0.1 /100 | #266 | Tragic 2.4% |