Subsaharan African vs White/Caucasian Vision Disability
COMPARE
Subsaharan African
White/Caucasian
Vision Disability
Vision Disability Comparison
Sub-Saharan Africans
Whites/Caucasians
2.3%
VISION DISABILITY
0.5/ 100
METRIC RATING
248th/ 347
METRIC RANK
2.4%
VISION DISABILITY
0.2/ 100
METRIC RATING
259th/ 347
METRIC RANK
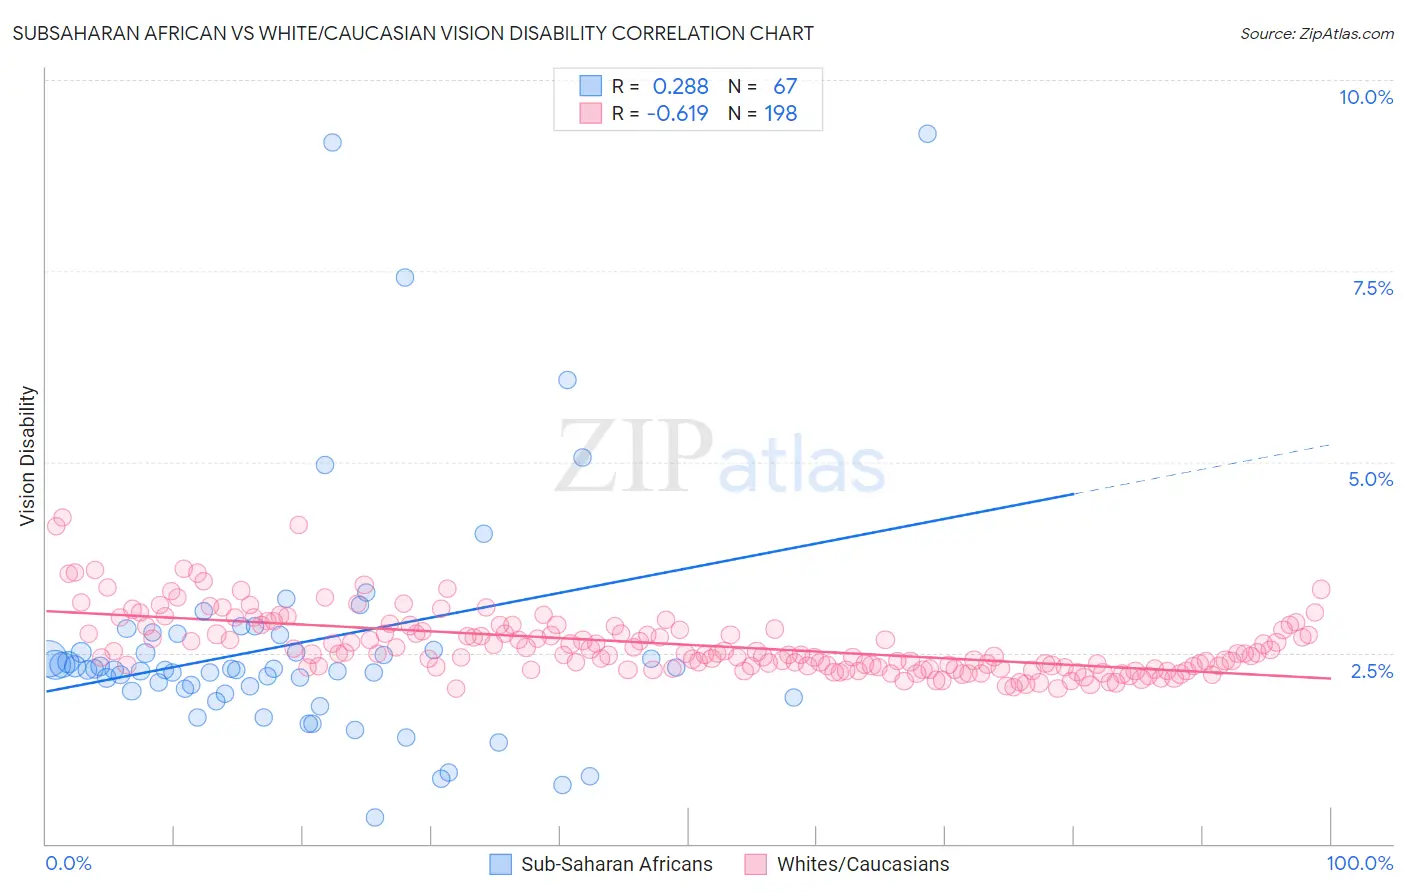
Subsaharan African vs White/Caucasian Vision Disability Correlation Chart
The statistical analysis conducted on geographies consisting of 507,474,731 people shows a weak positive correlation between the proportion of Sub-Saharan Africans and percentage of population with vision disability in the United States with a correlation coefficient (R) of 0.288 and weighted average of 2.3%. Similarly, the statistical analysis conducted on geographies consisting of 580,529,348 people shows a significant negative correlation between the proportion of Whites/Caucasians and percentage of population with vision disability in the United States with a correlation coefficient (R) of -0.619 and weighted average of 2.4%, a difference of 1.3%.
Vision Disability Correlation Summary
| Measurement | Subsaharan African | White/Caucasian |
| Minimum | 0.34% | 2.0% |
| Maximum | 9.3% | 4.3% |
| Range | 9.0% | 2.2% |
| Mean | 2.6% | 2.6% |
| Median | 2.3% | 2.5% |
| Interquartile 25% (IQ1) | 2.0% | 2.3% |
| Interquartile 75% (IQ3) | 2.7% | 2.8% |
| Interquartile Range (IQR) | 0.74% | 0.50% |
| Standard Deviation (Sample) | 1.6% | 0.41% |
| Standard Deviation (Population) | 1.6% | 0.41% |
Demographics Similar to Sub-Saharan Africans and Whites/Caucasians by Vision Disability
In terms of vision disability, the demographic groups most similar to Sub-Saharan Africans are Liberian (2.3%, a difference of 0.010%), Guatemalan (2.3%, a difference of 0.020%), French (2.3%, a difference of 0.060%), Bangladeshi (2.3%, a difference of 0.10%), and Alsatian (2.3%, a difference of 0.21%). Similarly, the demographic groups most similar to Whites/Caucasians are British West Indian (2.4%, a difference of 0.010%), West Indian (2.4%, a difference of 0.040%), Immigrants from Haiti (2.4%, a difference of 0.12%), Belizean (2.4%, a difference of 0.17%), and Fijian (2.4%, a difference of 0.38%).
| Demographics | Rating | Rank | Vision Disability |
| Immigrants | Nicaragua | 0.6 /100 | #243 | Tragic 2.3% |
| Immigrants | West Indies | 0.6 /100 | #244 | Tragic 2.3% |
| Alsatians | 0.6 /100 | #245 | Tragic 2.3% |
| French | 0.5 /100 | #246 | Tragic 2.3% |
| Guatemalans | 0.5 /100 | #247 | Tragic 2.3% |
| Sub-Saharan Africans | 0.5 /100 | #248 | Tragic 2.3% |
| Liberians | 0.5 /100 | #249 | Tragic 2.3% |
| Bangladeshis | 0.5 /100 | #250 | Tragic 2.3% |
| Immigrants | Laos | 0.4 /100 | #251 | Tragic 2.4% |
| Immigrants | Micronesia | 0.3 /100 | #252 | Tragic 2.4% |
| Japanese | 0.3 /100 | #253 | Tragic 2.4% |
| Haitians | 0.3 /100 | #254 | Tragic 2.4% |
| Immigrants | Guatemala | 0.3 /100 | #255 | Tragic 2.4% |
| Immigrants | Haiti | 0.2 /100 | #256 | Tragic 2.4% |
| West Indians | 0.2 /100 | #257 | Tragic 2.4% |
| British West Indians | 0.2 /100 | #258 | Tragic 2.4% |
| Whites/Caucasians | 0.2 /100 | #259 | Tragic 2.4% |
| Belizeans | 0.2 /100 | #260 | Tragic 2.4% |
| Fijians | 0.1 /100 | #261 | Tragic 2.4% |
| Jamaicans | 0.1 /100 | #262 | Tragic 2.4% |
| Immigrants | Belize | 0.1 /100 | #263 | Tragic 2.4% |