Serbian vs White/Caucasian Vision Disability
COMPARE
Serbian
White/Caucasian
Vision Disability
Vision Disability Comparison
Serbians
Whites/Caucasians
2.1%
VISION DISABILITY
70.2/ 100
METRIC RATING
157th/ 347
METRIC RANK
2.4%
VISION DISABILITY
0.2/ 100
METRIC RATING
259th/ 347
METRIC RANK
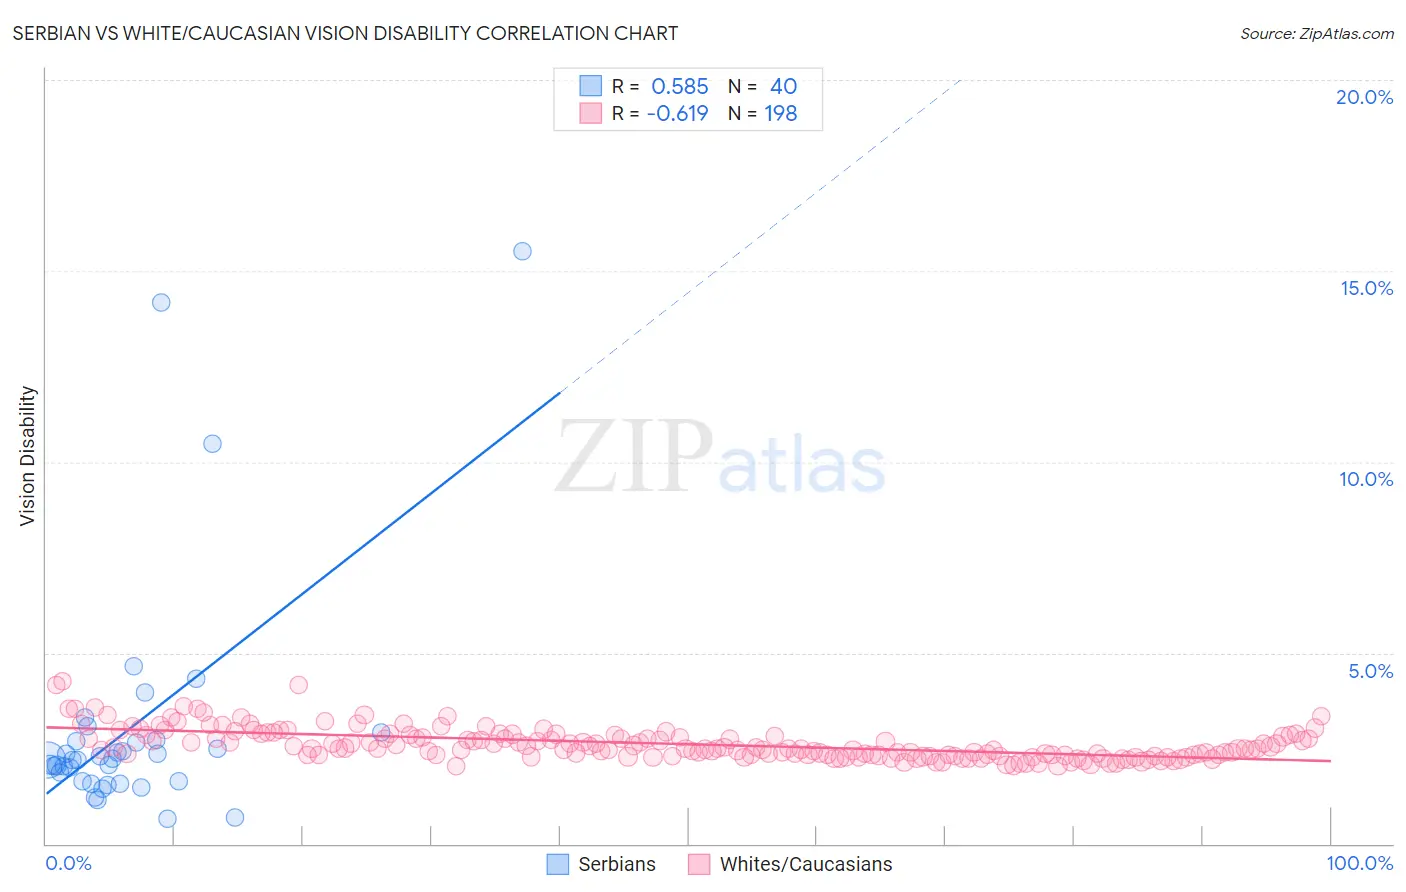
Serbian vs White/Caucasian Vision Disability Correlation Chart
The statistical analysis conducted on geographies consisting of 267,561,592 people shows a substantial positive correlation between the proportion of Serbians and percentage of population with vision disability in the United States with a correlation coefficient (R) of 0.585 and weighted average of 2.1%. Similarly, the statistical analysis conducted on geographies consisting of 580,529,348 people shows a significant negative correlation between the proportion of Whites/Caucasians and percentage of population with vision disability in the United States with a correlation coefficient (R) of -0.619 and weighted average of 2.4%, a difference of 11.3%.
Vision Disability Correlation Summary
| Measurement | Serbian | White/Caucasian |
| Minimum | 0.66% | 2.0% |
| Maximum | 15.5% | 4.3% |
| Range | 14.8% | 2.2% |
| Mean | 3.1% | 2.6% |
| Median | 2.2% | 2.5% |
| Interquartile 25% (IQ1) | 1.6% | 2.3% |
| Interquartile 75% (IQ3) | 2.7% | 2.8% |
| Interquartile Range (IQR) | 1.1% | 0.50% |
| Standard Deviation (Sample) | 3.1% | 0.41% |
| Standard Deviation (Population) | 3.1% | 0.41% |
Similar Demographics by Vision Disability
Demographics Similar to Serbians by Vision Disability
In terms of vision disability, the demographic groups most similar to Serbians are Immigrants from Uzbekistan (2.1%, a difference of 0.030%), South African (2.1%, a difference of 0.030%), Austrian (2.1%, a difference of 0.090%), Pakistani (2.1%, a difference of 0.11%), and Immigrants from Colombia (2.1%, a difference of 0.14%).
| Demographics | Rating | Rank | Vision Disability |
| Belgians | 75.9 /100 | #150 | Good 2.1% |
| Immigrants | Norway | 75.5 /100 | #151 | Good 2.1% |
| Immigrants | Southern Europe | 74.6 /100 | #152 | Good 2.1% |
| Immigrants | South America | 73.8 /100 | #153 | Good 2.1% |
| Slovenes | 73.6 /100 | #154 | Good 2.1% |
| Immigrants | Colombia | 72.1 /100 | #155 | Good 2.1% |
| Pakistanis | 71.6 /100 | #156 | Good 2.1% |
| Serbians | 70.2 /100 | #157 | Good 2.1% |
| Immigrants | Uzbekistan | 69.9 /100 | #158 | Good 2.1% |
| South Africans | 69.8 /100 | #159 | Good 2.1% |
| Austrians | 69.0 /100 | #160 | Good 2.1% |
| Iraqis | 67.7 /100 | #161 | Good 2.1% |
| Hungarians | 67.4 /100 | #162 | Good 2.1% |
| Icelanders | 66.1 /100 | #163 | Good 2.1% |
| Immigrants | Bangladesh | 65.5 /100 | #164 | Good 2.1% |
Demographics Similar to Whites/Caucasians by Vision Disability
In terms of vision disability, the demographic groups most similar to Whites/Caucasians are British West Indian (2.4%, a difference of 0.010%), West Indian (2.4%, a difference of 0.040%), Immigrants from Haiti (2.4%, a difference of 0.12%), Belizean (2.4%, a difference of 0.17%), and Fijian (2.4%, a difference of 0.38%).
| Demographics | Rating | Rank | Vision Disability |
| Immigrants | Micronesia | 0.3 /100 | #252 | Tragic 2.4% |
| Japanese | 0.3 /100 | #253 | Tragic 2.4% |
| Haitians | 0.3 /100 | #254 | Tragic 2.4% |
| Immigrants | Guatemala | 0.3 /100 | #255 | Tragic 2.4% |
| Immigrants | Haiti | 0.2 /100 | #256 | Tragic 2.4% |
| West Indians | 0.2 /100 | #257 | Tragic 2.4% |
| British West Indians | 0.2 /100 | #258 | Tragic 2.4% |
| Whites/Caucasians | 0.2 /100 | #259 | Tragic 2.4% |
| Belizeans | 0.2 /100 | #260 | Tragic 2.4% |
| Fijians | 0.1 /100 | #261 | Tragic 2.4% |
| Jamaicans | 0.1 /100 | #262 | Tragic 2.4% |
| Immigrants | Belize | 0.1 /100 | #263 | Tragic 2.4% |
| Immigrants | Liberia | 0.1 /100 | #264 | Tragic 2.4% |
| Immigrants | Jamaica | 0.1 /100 | #265 | Tragic 2.4% |
| Mexican American Indians | 0.1 /100 | #266 | Tragic 2.4% |