Immigrants from Laos vs Scandinavian Disability Age Under 5
COMPARE
Immigrants from Laos
Scandinavian
Disability Age Under 5
Disability Age Under 5 Comparison
Immigrants from Laos
Scandinavians
1.3%
DISABILITY AGE UNDER 5
36.6/ 100
METRIC RATING
190th/ 347
METRIC RANK
1.5%
DISABILITY AGE UNDER 5
0.0/ 100
METRIC RATING
287th/ 347
METRIC RANK
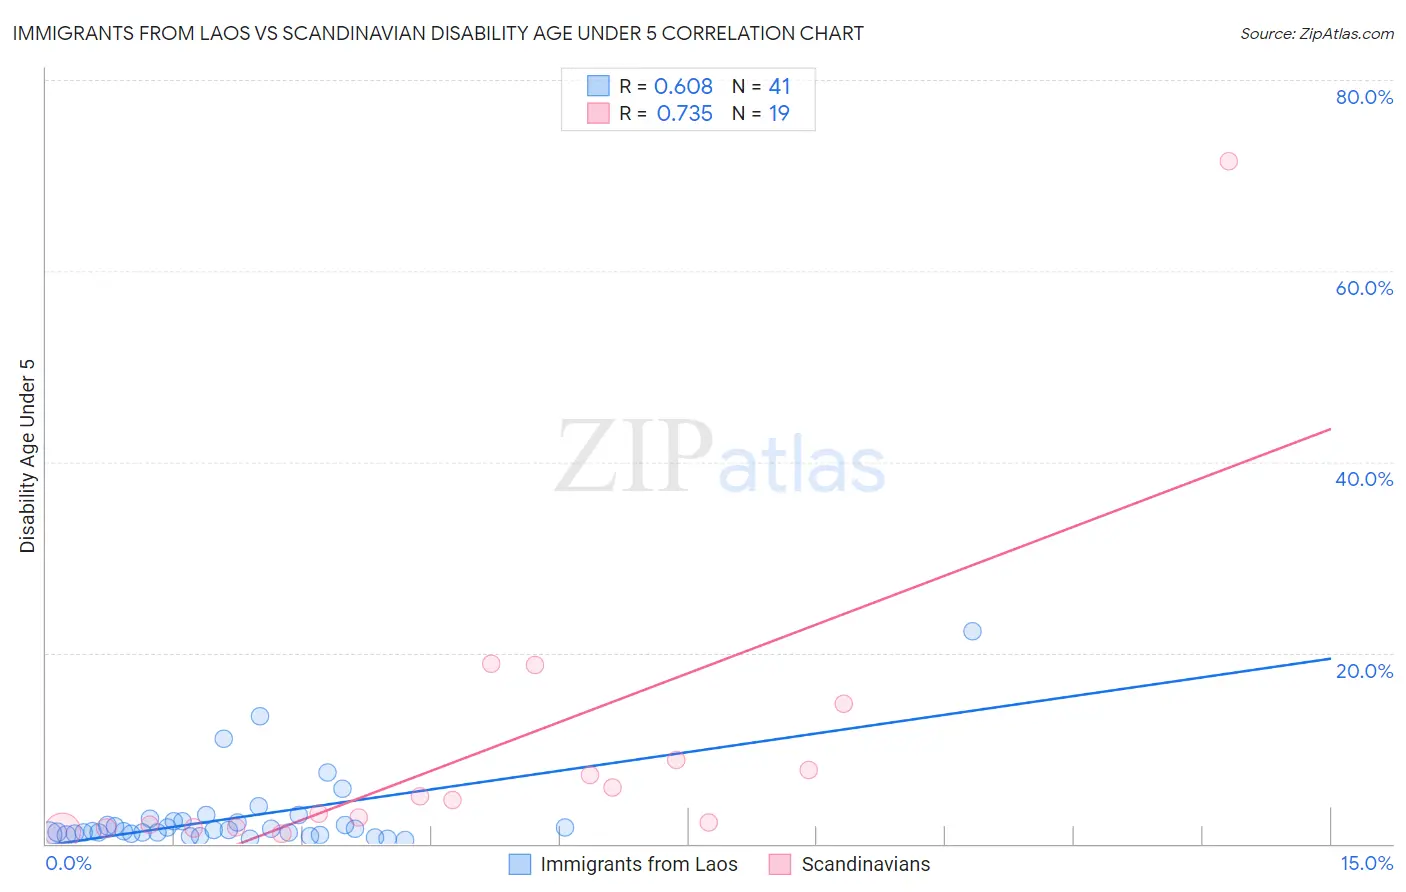
Immigrants from Laos vs Scandinavian Disability Age Under 5 Correlation Chart
The statistical analysis conducted on geographies consisting of 136,282,116 people shows a significant positive correlation between the proportion of Immigrants from Laos and percentage of population with a disability under the age of 5 in the United States with a correlation coefficient (R) of 0.608 and weighted average of 1.3%. Similarly, the statistical analysis conducted on geographies consisting of 234,208,425 people shows a strong positive correlation between the proportion of Scandinavians and percentage of population with a disability under the age of 5 in the United States with a correlation coefficient (R) of 0.735 and weighted average of 1.5%, a difference of 22.9%.
Disability Age Under 5 Correlation Summary
| Measurement | Immigrants from Laos | Scandinavian |
| Minimum | 0.33% | 1.1% |
| Maximum | 22.2% | 71.4% |
| Range | 21.9% | 70.3% |
| Mean | 2.8% | 9.5% |
| Median | 1.4% | 4.6% |
| Interquartile 25% (IQ1) | 0.97% | 1.7% |
| Interquartile 75% (IQ3) | 2.4% | 8.7% |
| Interquartile Range (IQR) | 1.4% | 7.0% |
| Standard Deviation (Sample) | 4.1% | 16.0% |
| Standard Deviation (Population) | 4.0% | 15.6% |
Similar Demographics by Disability Age Under 5
Demographics Similar to Immigrants from Laos by Disability Age Under 5
In terms of disability age under 5, the demographic groups most similar to Immigrants from Laos are Mexican American Indian (1.3%, a difference of 0.010%), Immigrants from Bosnia and Herzegovina (1.3%, a difference of 0.010%), Immigrants from Sierra Leone (1.3%, a difference of 0.010%), Peruvian (1.3%, a difference of 0.090%), and Immigrants from North Macedonia (1.3%, a difference of 0.19%).
| Demographics | Rating | Rank | Disability Age Under 5 |
| Immigrants | Saudi Arabia | 43.3 /100 | #183 | Average 1.2% |
| Palestinians | 43.0 /100 | #184 | Average 1.2% |
| Immigrants | Western Africa | 42.5 /100 | #185 | Average 1.2% |
| Cubans | 42.5 /100 | #186 | Average 1.2% |
| Immigrants | Haiti | 40.2 /100 | #187 | Average 1.3% |
| Haitians | 39.9 /100 | #188 | Fair 1.3% |
| Peruvians | 37.6 /100 | #189 | Fair 1.3% |
| Immigrants | Laos | 36.6 /100 | #190 | Fair 1.3% |
| Mexican American Indians | 36.6 /100 | #191 | Fair 1.3% |
| Immigrants | Bosnia and Herzegovina | 36.5 /100 | #192 | Fair 1.3% |
| Immigrants | Sierra Leone | 36.5 /100 | #193 | Fair 1.3% |
| Immigrants | North Macedonia | 34.7 /100 | #194 | Fair 1.3% |
| U.S. Virgin Islanders | 34.4 /100 | #195 | Fair 1.3% |
| Immigrants | Belgium | 31.4 /100 | #196 | Fair 1.3% |
| Immigrants | Somalia | 31.3 /100 | #197 | Fair 1.3% |
Demographics Similar to Scandinavians by Disability Age Under 5
In terms of disability age under 5, the demographic groups most similar to Scandinavians are Tlingit-Haida (1.5%, a difference of 0.050%), Estonian (1.5%, a difference of 0.18%), Croatian (1.5%, a difference of 0.30%), Hungarian (1.5%, a difference of 0.32%), and Czech (1.5%, a difference of 0.45%).
| Demographics | Rating | Rank | Disability Age Under 5 |
| British | 0.0 /100 | #280 | Tragic 1.5% |
| Czechoslovakians | 0.0 /100 | #281 | Tragic 1.5% |
| Cheyenne | 0.0 /100 | #282 | Tragic 1.5% |
| Delaware | 0.0 /100 | #283 | Tragic 1.5% |
| Europeans | 0.0 /100 | #284 | Tragic 1.5% |
| Croatians | 0.0 /100 | #285 | Tragic 1.5% |
| Tlingit-Haida | 0.0 /100 | #286 | Tragic 1.5% |
| Scandinavians | 0.0 /100 | #287 | Tragic 1.5% |
| Estonians | 0.0 /100 | #288 | Tragic 1.5% |
| Hungarians | 0.0 /100 | #289 | Tragic 1.5% |
| Czechs | 0.0 /100 | #290 | Tragic 1.5% |
| Northern Europeans | 0.0 /100 | #291 | Tragic 1.6% |
| Italians | 0.0 /100 | #292 | Tragic 1.6% |
| Lithuanians | 0.0 /100 | #293 | Tragic 1.6% |
| Swedes | 0.0 /100 | #294 | Tragic 1.6% |