Scottish vs Scandinavian Disability Age Under 5
COMPARE
Scottish
Scandinavian
Disability Age Under 5
Disability Age Under 5 Comparison
Scottish
Scandinavians
1.6%
DISABILITY AGE UNDER 5
0.0/ 100
METRIC RATING
307th/ 347
METRIC RANK
1.5%
DISABILITY AGE UNDER 5
0.0/ 100
METRIC RATING
287th/ 347
METRIC RANK
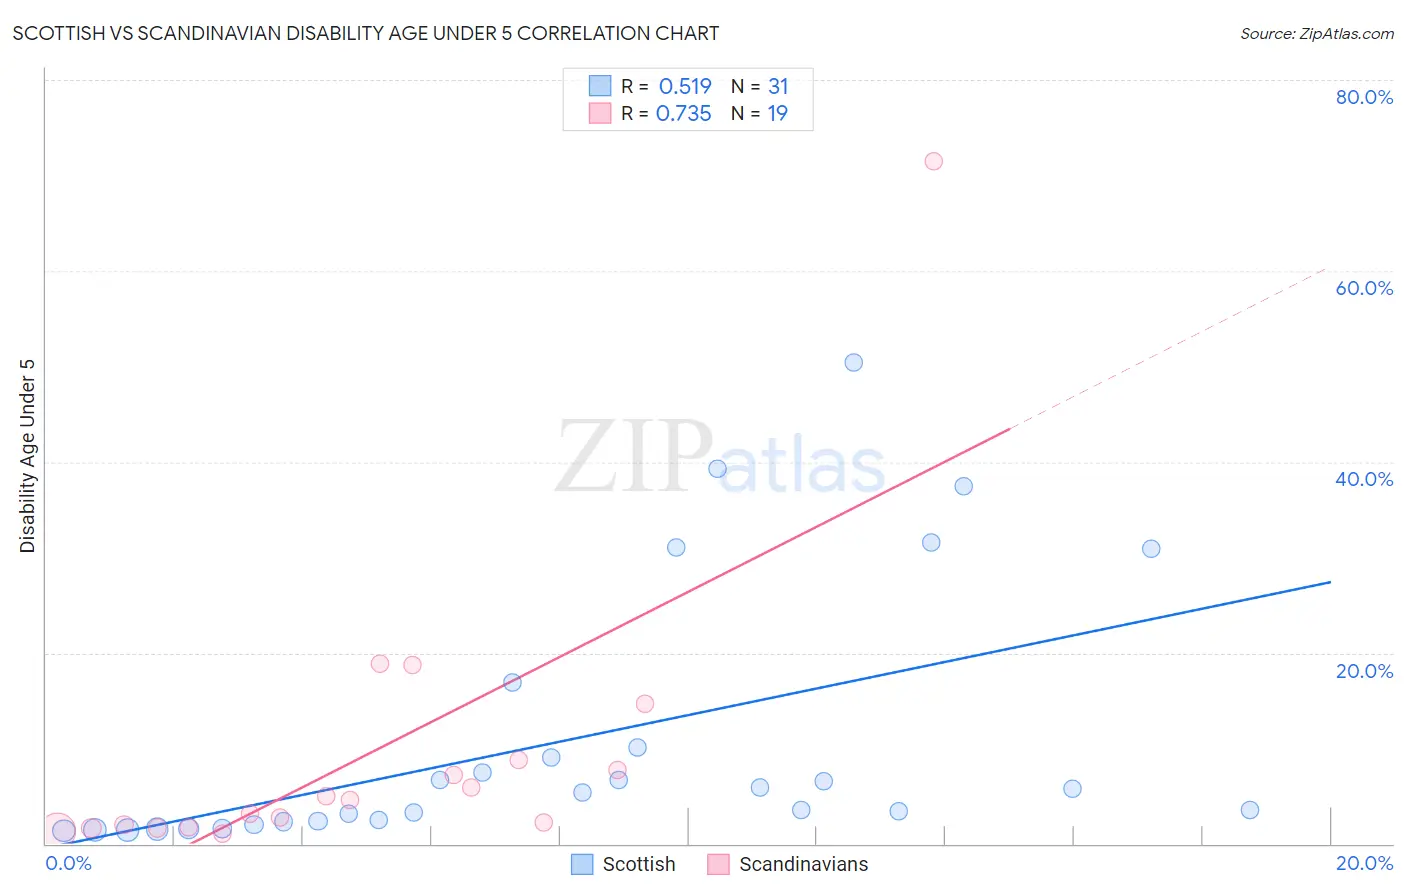
Scottish vs Scandinavian Disability Age Under 5 Correlation Chart
The statistical analysis conducted on geographies consisting of 258,599,259 people shows a substantial positive correlation between the proportion of Scottish and percentage of population with a disability under the age of 5 in the United States with a correlation coefficient (R) of 0.519 and weighted average of 1.6%. Similarly, the statistical analysis conducted on geographies consisting of 234,208,425 people shows a strong positive correlation between the proportion of Scandinavians and percentage of population with a disability under the age of 5 in the United States with a correlation coefficient (R) of 0.735 and weighted average of 1.5%, a difference of 6.7%.
Disability Age Under 5 Correlation Summary
| Measurement | Scottish | Scandinavian |
| Minimum | 1.4% | 1.1% |
| Maximum | 50.4% | 71.4% |
| Range | 49.0% | 70.3% |
| Mean | 10.8% | 9.5% |
| Median | 5.3% | 4.6% |
| Interquartile 25% (IQ1) | 2.3% | 1.7% |
| Interquartile 75% (IQ3) | 10.1% | 8.7% |
| Interquartile Range (IQR) | 7.8% | 7.0% |
| Standard Deviation (Sample) | 13.7% | 16.0% |
| Standard Deviation (Population) | 13.4% | 15.6% |
Demographics Similar to Scottish and Scandinavians by Disability Age Under 5
In terms of disability age under 5, the demographic groups most similar to Scottish are Creek (1.6%, a difference of 0.070%), Blackfeet (1.6%, a difference of 0.10%), Seminole (1.6%, a difference of 0.26%), Swiss (1.6%, a difference of 0.90%), and Welsh (1.6%, a difference of 1.1%). Similarly, the demographic groups most similar to Scandinavians are Estonian (1.5%, a difference of 0.18%), Hungarian (1.5%, a difference of 0.32%), Czech (1.5%, a difference of 0.45%), Northern European (1.6%, a difference of 0.54%), and Italian (1.6%, a difference of 0.69%).
| Demographics | Rating | Rank | Disability Age Under 5 |
| Scandinavians | 0.0 /100 | #287 | Tragic 1.5% |
| Estonians | 0.0 /100 | #288 | Tragic 1.5% |
| Hungarians | 0.0 /100 | #289 | Tragic 1.5% |
| Czechs | 0.0 /100 | #290 | Tragic 1.5% |
| Northern Europeans | 0.0 /100 | #291 | Tragic 1.6% |
| Italians | 0.0 /100 | #292 | Tragic 1.6% |
| Lithuanians | 0.0 /100 | #293 | Tragic 1.6% |
| Swedes | 0.0 /100 | #294 | Tragic 1.6% |
| Finns | 0.0 /100 | #295 | Tragic 1.6% |
| Poles | 0.0 /100 | #296 | Tragic 1.6% |
| Immigrants | Nonimmigrants | 0.0 /100 | #297 | Tragic 1.6% |
| Cajuns | 0.0 /100 | #298 | Tragic 1.6% |
| Portuguese | 0.0 /100 | #299 | Tragic 1.6% |
| Shoshone | 0.0 /100 | #300 | Tragic 1.6% |
| German Russians | 0.0 /100 | #301 | Tragic 1.6% |
| Welsh | 0.0 /100 | #302 | Tragic 1.6% |
| Swiss | 0.0 /100 | #303 | Tragic 1.6% |
| Seminole | 0.0 /100 | #304 | Tragic 1.6% |
| Blackfeet | 0.0 /100 | #305 | Tragic 1.6% |
| Creek | 0.0 /100 | #306 | Tragic 1.6% |
| Scottish | 0.0 /100 | #307 | Tragic 1.6% |