Immigrants from Laos vs Lebanese Disability Age Under 5
COMPARE
Immigrants from Laos
Lebanese
Disability Age Under 5
Disability Age Under 5 Comparison
Immigrants from Laos
Lebanese
1.3%
DISABILITY AGE UNDER 5
36.6/ 100
METRIC RATING
190th/ 347
METRIC RANK
1.3%
DISABILITY AGE UNDER 5
5.3/ 100
METRIC RATING
230th/ 347
METRIC RANK
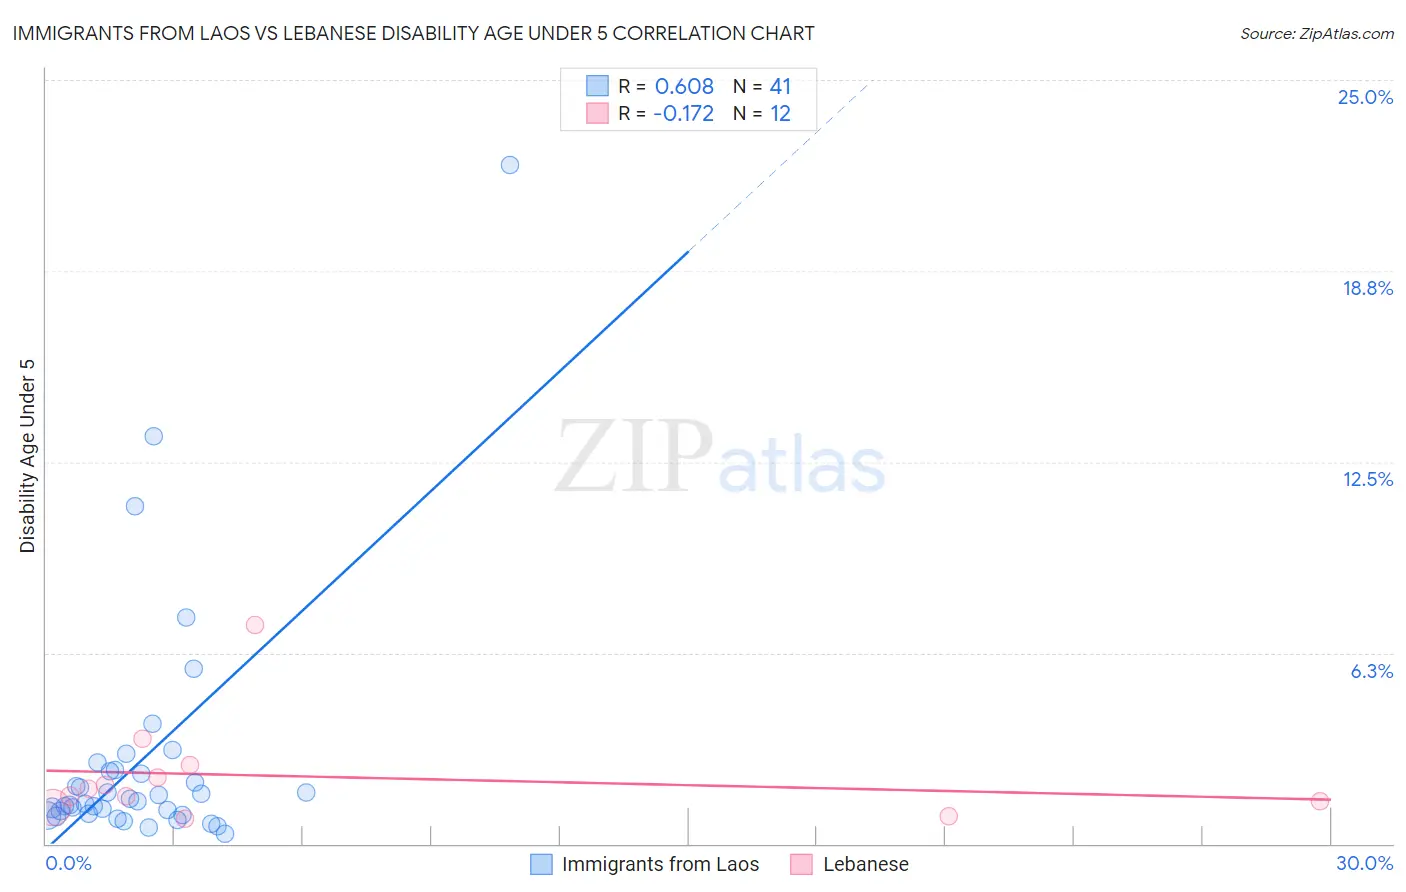
Immigrants from Laos vs Lebanese Disability Age Under 5 Correlation Chart
The statistical analysis conducted on geographies consisting of 136,282,116 people shows a significant positive correlation between the proportion of Immigrants from Laos and percentage of population with a disability under the age of 5 in the United States with a correlation coefficient (R) of 0.608 and weighted average of 1.3%. Similarly, the statistical analysis conducted on geographies consisting of 215,601,141 people shows a poor negative correlation between the proportion of Lebanese and percentage of population with a disability under the age of 5 in the United States with a correlation coefficient (R) of -0.172 and weighted average of 1.3%, a difference of 5.2%.
Disability Age Under 5 Correlation Summary
| Measurement | Immigrants from Laos | Lebanese |
| Minimum | 0.33% | 0.84% |
| Maximum | 22.2% | 7.1% |
| Range | 21.9% | 6.3% |
| Mean | 2.8% | 2.2% |
| Median | 1.4% | 1.7% |
| Interquartile 25% (IQ1) | 0.97% | 1.3% |
| Interquartile 75% (IQ3) | 2.4% | 2.4% |
| Interquartile Range (IQR) | 1.4% | 1.1% |
| Standard Deviation (Sample) | 4.1% | 1.7% |
| Standard Deviation (Population) | 4.0% | 1.6% |
Similar Demographics by Disability Age Under 5
Demographics Similar to Immigrants from Laos by Disability Age Under 5
In terms of disability age under 5, the demographic groups most similar to Immigrants from Laos are Mexican American Indian (1.3%, a difference of 0.010%), Immigrants from Bosnia and Herzegovina (1.3%, a difference of 0.010%), Immigrants from Sierra Leone (1.3%, a difference of 0.010%), Peruvian (1.3%, a difference of 0.090%), and Immigrants from North Macedonia (1.3%, a difference of 0.19%).
| Demographics | Rating | Rank | Disability Age Under 5 |
| Immigrants | Saudi Arabia | 43.3 /100 | #183 | Average 1.2% |
| Palestinians | 43.0 /100 | #184 | Average 1.2% |
| Immigrants | Western Africa | 42.5 /100 | #185 | Average 1.2% |
| Cubans | 42.5 /100 | #186 | Average 1.2% |
| Immigrants | Haiti | 40.2 /100 | #187 | Average 1.3% |
| Haitians | 39.9 /100 | #188 | Fair 1.3% |
| Peruvians | 37.6 /100 | #189 | Fair 1.3% |
| Immigrants | Laos | 36.6 /100 | #190 | Fair 1.3% |
| Mexican American Indians | 36.6 /100 | #191 | Fair 1.3% |
| Immigrants | Bosnia and Herzegovina | 36.5 /100 | #192 | Fair 1.3% |
| Immigrants | Sierra Leone | 36.5 /100 | #193 | Fair 1.3% |
| Immigrants | North Macedonia | 34.7 /100 | #194 | Fair 1.3% |
| U.S. Virgin Islanders | 34.4 /100 | #195 | Fair 1.3% |
| Immigrants | Belgium | 31.4 /100 | #196 | Fair 1.3% |
| Immigrants | Somalia | 31.3 /100 | #197 | Fair 1.3% |
Demographics Similar to Lebanese by Disability Age Under 5
In terms of disability age under 5, the demographic groups most similar to Lebanese are Immigrants from Costa Rica (1.3%, a difference of 0.10%), Immigrants from Northern Europe (1.3%, a difference of 0.25%), Luxembourger (1.3%, a difference of 0.31%), Taiwanese (1.3%, a difference of 0.32%), and French American Indian (1.3%, a difference of 0.38%).
| Demographics | Rating | Rank | Disability Age Under 5 |
| Hispanics or Latinos | 7.7 /100 | #223 | Tragic 1.3% |
| Latvians | 7.1 /100 | #224 | Tragic 1.3% |
| Panamanians | 7.1 /100 | #225 | Tragic 1.3% |
| Bahamians | 7.1 /100 | #226 | Tragic 1.3% |
| Taiwanese | 6.1 /100 | #227 | Tragic 1.3% |
| Luxembourgers | 6.1 /100 | #228 | Tragic 1.3% |
| Immigrants | Costa Rica | 5.5 /100 | #229 | Tragic 1.3% |
| Lebanese | 5.3 /100 | #230 | Tragic 1.3% |
| Immigrants | Northern Europe | 4.7 /100 | #231 | Tragic 1.3% |
| French American Indians | 4.5 /100 | #232 | Tragic 1.3% |
| Tongans | 4.2 /100 | #233 | Tragic 1.3% |
| Pueblo | 3.8 /100 | #234 | Tragic 1.3% |
| Central American Indians | 3.6 /100 | #235 | Tragic 1.3% |
| South American Indians | 3.3 /100 | #236 | Tragic 1.3% |
| Basques | 3.0 /100 | #237 | Tragic 1.3% |