Immigrants from Argentina vs Scandinavian Disability Age Under 5
COMPARE
Immigrants from Argentina
Scandinavian
Disability Age Under 5
Disability Age Under 5 Comparison
Immigrants from Argentina
Scandinavians
1.2%
DISABILITY AGE UNDER 5
60.2/ 100
METRIC RATING
167th/ 347
METRIC RANK
1.5%
DISABILITY AGE UNDER 5
0.0/ 100
METRIC RATING
287th/ 347
METRIC RANK
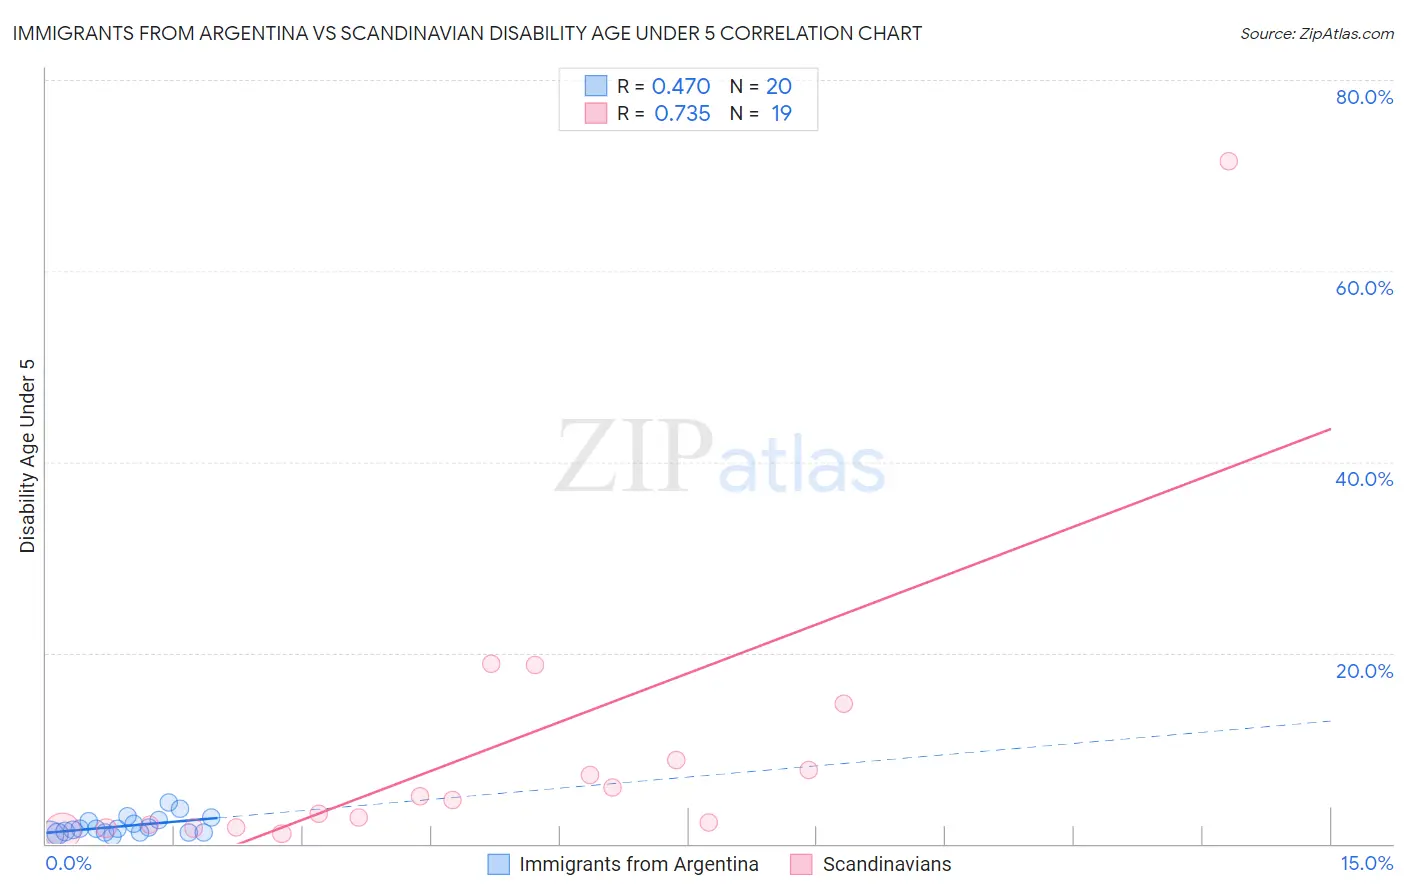
Immigrants from Argentina vs Scandinavian Disability Age Under 5 Correlation Chart
The statistical analysis conducted on geographies consisting of 162,990,618 people shows a moderate positive correlation between the proportion of Immigrants from Argentina and percentage of population with a disability under the age of 5 in the United States with a correlation coefficient (R) of 0.470 and weighted average of 1.2%. Similarly, the statistical analysis conducted on geographies consisting of 234,208,425 people shows a strong positive correlation between the proportion of Scandinavians and percentage of population with a disability under the age of 5 in the United States with a correlation coefficient (R) of 0.735 and weighted average of 1.5%, a difference of 25.6%.
Disability Age Under 5 Correlation Summary
| Measurement | Immigrants from Argentina | Scandinavian |
| Minimum | 0.80% | 1.1% |
| Maximum | 4.3% | 71.4% |
| Range | 3.5% | 70.3% |
| Mean | 1.9% | 9.5% |
| Median | 1.6% | 4.6% |
| Interquartile 25% (IQ1) | 1.2% | 1.7% |
| Interquartile 75% (IQ3) | 2.4% | 8.7% |
| Interquartile Range (IQR) | 1.2% | 7.0% |
| Standard Deviation (Sample) | 0.95% | 16.0% |
| Standard Deviation (Population) | 0.93% | 15.6% |
Similar Demographics by Disability Age Under 5
Demographics Similar to Immigrants from Argentina by Disability Age Under 5
In terms of disability age under 5, the demographic groups most similar to Immigrants from Argentina are Immigrants from Central America (1.2%, a difference of 0.11%), Sierra Leonean (1.2%, a difference of 0.11%), Immigrants from Uruguay (1.2%, a difference of 0.12%), Immigrants from Jamaica (1.2%, a difference of 0.13%), and Immigrants from Kuwait (1.2%, a difference of 0.22%).
| Demographics | Rating | Rank | Disability Age Under 5 |
| Immigrants | Latin America | 65.8 /100 | #160 | Good 1.2% |
| Immigrants | Africa | 65.1 /100 | #161 | Good 1.2% |
| Guatemalans | 63.6 /100 | #162 | Good 1.2% |
| Immigrants | Guatemala | 63.2 /100 | #163 | Good 1.2% |
| Laotians | 62.8 /100 | #164 | Good 1.2% |
| Immigrants | Kuwait | 62.6 /100 | #165 | Good 1.2% |
| Immigrants | Central America | 61.4 /100 | #166 | Good 1.2% |
| Immigrants | Argentina | 60.2 /100 | #167 | Good 1.2% |
| Sierra Leoneans | 59.1 /100 | #168 | Average 1.2% |
| Immigrants | Uruguay | 59.0 /100 | #169 | Average 1.2% |
| Immigrants | Jamaica | 58.8 /100 | #170 | Average 1.2% |
| Guamanians/Chamorros | 57.8 /100 | #171 | Average 1.2% |
| Crow | 51.0 /100 | #172 | Average 1.2% |
| Immigrants | Ireland | 50.3 /100 | #173 | Average 1.2% |
| Immigrants | Latvia | 50.0 /100 | #174 | Average 1.2% |
Demographics Similar to Scandinavians by Disability Age Under 5
In terms of disability age under 5, the demographic groups most similar to Scandinavians are Tlingit-Haida (1.5%, a difference of 0.050%), Estonian (1.5%, a difference of 0.18%), Croatian (1.5%, a difference of 0.30%), Hungarian (1.5%, a difference of 0.32%), and Czech (1.5%, a difference of 0.45%).
| Demographics | Rating | Rank | Disability Age Under 5 |
| British | 0.0 /100 | #280 | Tragic 1.5% |
| Czechoslovakians | 0.0 /100 | #281 | Tragic 1.5% |
| Cheyenne | 0.0 /100 | #282 | Tragic 1.5% |
| Delaware | 0.0 /100 | #283 | Tragic 1.5% |
| Europeans | 0.0 /100 | #284 | Tragic 1.5% |
| Croatians | 0.0 /100 | #285 | Tragic 1.5% |
| Tlingit-Haida | 0.0 /100 | #286 | Tragic 1.5% |
| Scandinavians | 0.0 /100 | #287 | Tragic 1.5% |
| Estonians | 0.0 /100 | #288 | Tragic 1.5% |
| Hungarians | 0.0 /100 | #289 | Tragic 1.5% |
| Czechs | 0.0 /100 | #290 | Tragic 1.5% |
| Northern Europeans | 0.0 /100 | #291 | Tragic 1.6% |
| Italians | 0.0 /100 | #292 | Tragic 1.6% |
| Lithuanians | 0.0 /100 | #293 | Tragic 1.6% |
| Swedes | 0.0 /100 | #294 | Tragic 1.6% |