Immigrants from Laos vs Immigrants from Bangladesh Disability Age Under 5
COMPARE
Immigrants from Laos
Immigrants from Bangladesh
Disability Age Under 5
Disability Age Under 5 Comparison
Immigrants from Laos
Immigrants from Bangladesh
1.3%
DISABILITY AGE UNDER 5
36.6/ 100
METRIC RATING
190th/ 347
METRIC RANK
0.85%
DISABILITY AGE UNDER 5
100.0/ 100
METRIC RATING
5th/ 347
METRIC RANK
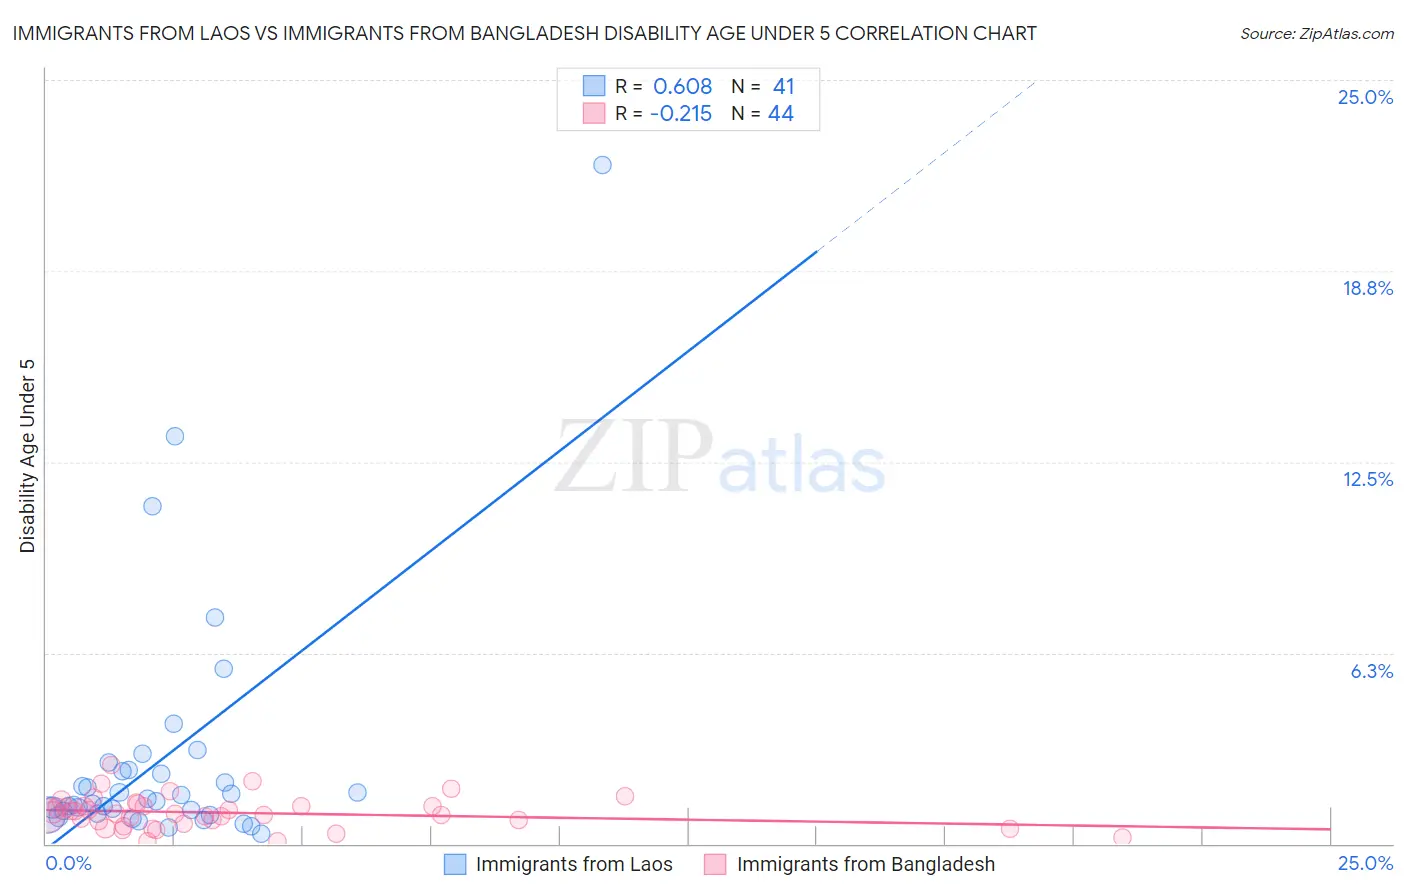
Immigrants from Laos vs Immigrants from Bangladesh Disability Age Under 5 Correlation Chart
The statistical analysis conducted on geographies consisting of 136,282,116 people shows a significant positive correlation between the proportion of Immigrants from Laos and percentage of population with a disability under the age of 5 in the United States with a correlation coefficient (R) of 0.608 and weighted average of 1.3%. Similarly, the statistical analysis conducted on geographies consisting of 131,826,697 people shows a weak negative correlation between the proportion of Immigrants from Bangladesh and percentage of population with a disability under the age of 5 in the United States with a correlation coefficient (R) of -0.215 and weighted average of 0.85%, a difference of 47.2%.
Disability Age Under 5 Correlation Summary
| Measurement | Immigrants from Laos | Immigrants from Bangladesh |
| Minimum | 0.33% | 0.063% |
| Maximum | 22.2% | 2.6% |
| Range | 21.9% | 2.5% |
| Mean | 2.8% | 1.0% |
| Median | 1.4% | 0.99% |
| Interquartile 25% (IQ1) | 0.97% | 0.70% |
| Interquartile 75% (IQ3) | 2.4% | 1.2% |
| Interquartile Range (IQR) | 1.4% | 0.53% |
| Standard Deviation (Sample) | 4.1% | 0.52% |
| Standard Deviation (Population) | 4.0% | 0.52% |
Similar Demographics by Disability Age Under 5
Demographics Similar to Immigrants from Laos by Disability Age Under 5
In terms of disability age under 5, the demographic groups most similar to Immigrants from Laos are Mexican American Indian (1.3%, a difference of 0.010%), Immigrants from Bosnia and Herzegovina (1.3%, a difference of 0.010%), Immigrants from Sierra Leone (1.3%, a difference of 0.010%), Peruvian (1.3%, a difference of 0.090%), and Immigrants from North Macedonia (1.3%, a difference of 0.19%).
| Demographics | Rating | Rank | Disability Age Under 5 |
| Immigrants | Saudi Arabia | 43.3 /100 | #183 | Average 1.2% |
| Palestinians | 43.0 /100 | #184 | Average 1.2% |
| Immigrants | Western Africa | 42.5 /100 | #185 | Average 1.2% |
| Cubans | 42.5 /100 | #186 | Average 1.2% |
| Immigrants | Haiti | 40.2 /100 | #187 | Average 1.3% |
| Haitians | 39.9 /100 | #188 | Fair 1.3% |
| Peruvians | 37.6 /100 | #189 | Fair 1.3% |
| Immigrants | Laos | 36.6 /100 | #190 | Fair 1.3% |
| Mexican American Indians | 36.6 /100 | #191 | Fair 1.3% |
| Immigrants | Bosnia and Herzegovina | 36.5 /100 | #192 | Fair 1.3% |
| Immigrants | Sierra Leone | 36.5 /100 | #193 | Fair 1.3% |
| Immigrants | North Macedonia | 34.7 /100 | #194 | Fair 1.3% |
| U.S. Virgin Islanders | 34.4 /100 | #195 | Fair 1.3% |
| Immigrants | Belgium | 31.4 /100 | #196 | Fair 1.3% |
| Immigrants | Somalia | 31.3 /100 | #197 | Fair 1.3% |
Demographics Similar to Immigrants from Bangladesh by Disability Age Under 5
In terms of disability age under 5, the demographic groups most similar to Immigrants from Bangladesh are Immigrants from Uzbekistan (0.85%, a difference of 0.41%), Ute (0.86%, a difference of 0.93%), Vietnamese (0.81%, a difference of 5.0%), Immigrants from Afghanistan (0.91%, a difference of 6.3%), and Immigrants from Yemen (0.91%, a difference of 6.4%).
| Demographics | Rating | Rank | Disability Age Under 5 |
| Immigrants | Armenia | 100.0 /100 | #1 | Exceptional 0.76% |
| Immigrants | St. Vincent and the Grenadines | 100.0 /100 | #2 | Exceptional 0.79% |
| Vietnamese | 100.0 /100 | #3 | Exceptional 0.81% |
| Immigrants | Uzbekistan | 100.0 /100 | #4 | Exceptional 0.85% |
| Immigrants | Bangladesh | 100.0 /100 | #5 | Exceptional 0.85% |
| Ute | 100.0 /100 | #6 | Exceptional 0.86% |
| Immigrants | Afghanistan | 100.0 /100 | #7 | Exceptional 0.91% |
| Immigrants | Yemen | 100.0 /100 | #8 | Exceptional 0.91% |
| Immigrants | Fiji | 100.0 /100 | #9 | Exceptional 0.92% |
| Marshallese | 100.0 /100 | #10 | Exceptional 0.94% |
| Afghans | 100.0 /100 | #11 | Exceptional 0.94% |
| Immigrants | Grenada | 100.0 /100 | #12 | Exceptional 0.94% |
| Soviet Union | 100.0 /100 | #13 | Exceptional 0.95% |
| Yuman | 100.0 /100 | #14 | Exceptional 0.95% |
| Immigrants | Hong Kong | 100.0 /100 | #15 | Exceptional 0.95% |