Immigrants from Korea vs German Self-Care Disability
COMPARE
Immigrants from Korea
German
Self-Care Disability
Self-Care Disability Comparison
Immigrants from Korea
Germans
2.3%
SELF-CARE DISABILITY
99.9/ 100
METRIC RATING
33rd/ 347
METRIC RANK
2.4%
SELF-CARE DISABILITY
80.1/ 100
METRIC RATING
145th/ 347
METRIC RANK
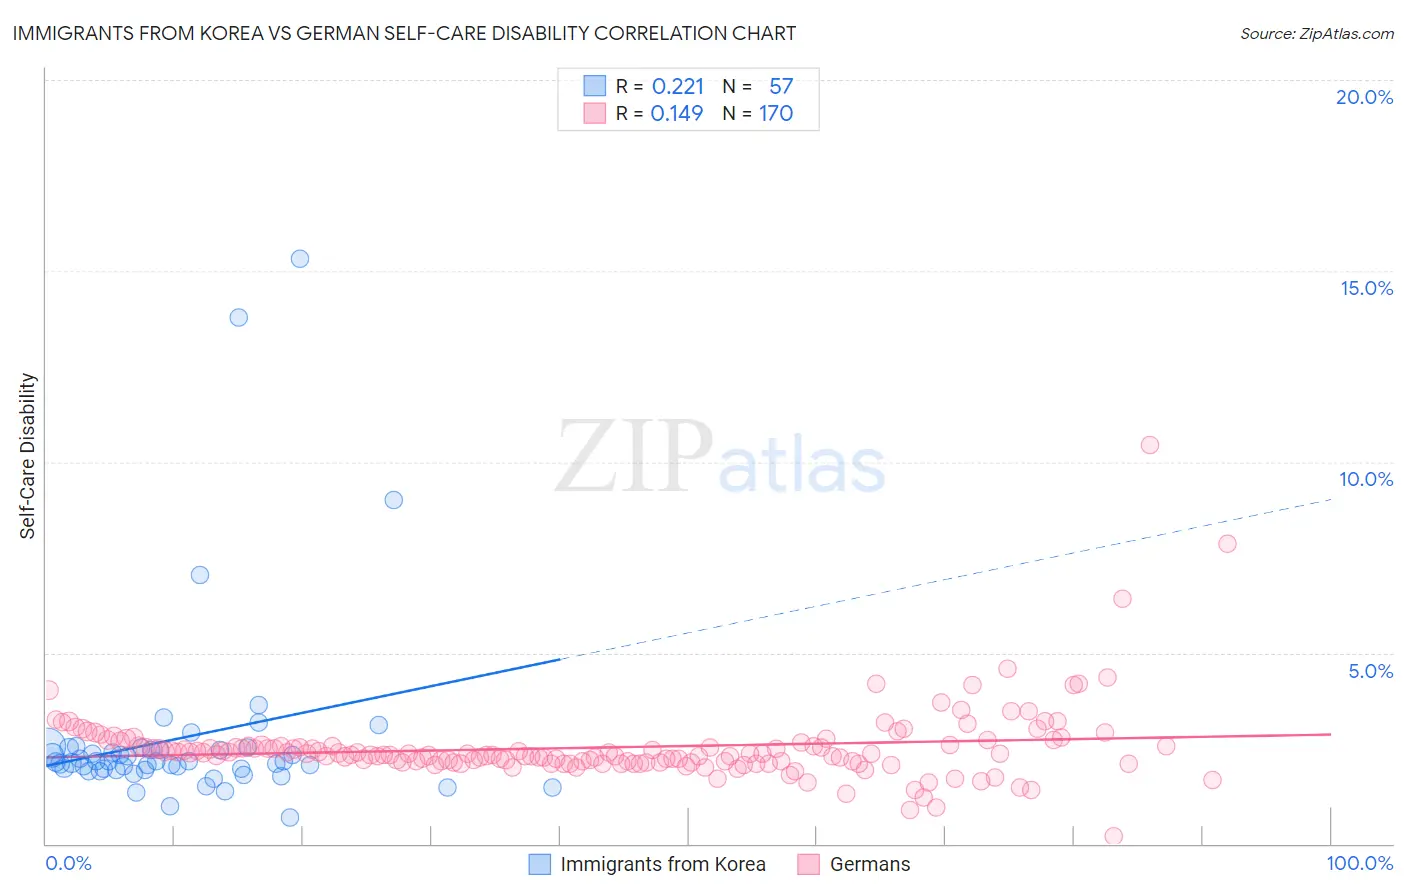
Immigrants from Korea vs German Self-Care Disability Correlation Chart
The statistical analysis conducted on geographies consisting of 415,570,089 people shows a weak positive correlation between the proportion of Immigrants from Korea and percentage of population with self-care disability in the United States with a correlation coefficient (R) of 0.221 and weighted average of 2.3%. Similarly, the statistical analysis conducted on geographies consisting of 577,887,813 people shows a poor positive correlation between the proportion of Germans and percentage of population with self-care disability in the United States with a correlation coefficient (R) of 0.149 and weighted average of 2.4%, a difference of 7.1%.
Self-Care Disability Correlation Summary
| Measurement | Immigrants from Korea | German |
| Minimum | 0.68% | 0.20% |
| Maximum | 15.3% | 10.5% |
| Range | 14.6% | 10.3% |
| Mean | 2.8% | 2.5% |
| Median | 2.1% | 2.3% |
| Interquartile 25% (IQ1) | 1.9% | 2.1% |
| Interquartile 75% (IQ3) | 2.5% | 2.6% |
| Interquartile Range (IQR) | 0.57% | 0.42% |
| Standard Deviation (Sample) | 2.6% | 1.00% |
| Standard Deviation (Population) | 2.6% | 1.00% |
Similar Demographics by Self-Care Disability
Demographics Similar to Immigrants from Korea by Self-Care Disability
In terms of self-care disability, the demographic groups most similar to Immigrants from Korea are Immigrants from Turkey (2.3%, a difference of 0.060%), Immigrants from Australia (2.3%, a difference of 0.12%), Immigrants from Lithuania (2.3%, a difference of 0.13%), Burmese (2.3%, a difference of 0.23%), and Danish (2.3%, a difference of 0.30%).
| Demographics | Rating | Rank | Self-Care Disability |
| Immigrants | Sri Lanka | 99.9 /100 | #26 | Exceptional 2.2% |
| Venezuelans | 99.9 /100 | #27 | Exceptional 2.2% |
| Inupiat | 99.9 /100 | #28 | Exceptional 2.2% |
| Immigrants | Zimbabwe | 99.9 /100 | #29 | Exceptional 2.3% |
| Paraguayans | 99.9 /100 | #30 | Exceptional 2.3% |
| Danes | 99.9 /100 | #31 | Exceptional 2.3% |
| Burmese | 99.9 /100 | #32 | Exceptional 2.3% |
| Immigrants | Korea | 99.9 /100 | #33 | Exceptional 2.3% |
| Immigrants | Turkey | 99.9 /100 | #34 | Exceptional 2.3% |
| Immigrants | Australia | 99.9 /100 | #35 | Exceptional 2.3% |
| Immigrants | Lithuania | 99.9 /100 | #36 | Exceptional 2.3% |
| Immigrants | Sweden | 99.9 /100 | #37 | Exceptional 2.3% |
| Immigrants | Eastern Africa | 99.9 /100 | #38 | Exceptional 2.3% |
| Immigrants | Bulgaria | 99.8 /100 | #39 | Exceptional 2.3% |
| Iranians | 99.8 /100 | #40 | Exceptional 2.3% |
Demographics Similar to Germans by Self-Care Disability
In terms of self-care disability, the demographic groups most similar to Germans are Israeli (2.4%, a difference of 0.010%), Costa Rican (2.4%, a difference of 0.050%), Afghan (2.4%, a difference of 0.17%), Dutch (2.4%, a difference of 0.19%), and Immigrants from Peru (2.4%, a difference of 0.25%).
| Demographics | Rating | Rank | Self-Care Disability |
| Immigrants | Croatia | 86.6 /100 | #138 | Excellent 2.4% |
| Sri Lankans | 86.6 /100 | #139 | Excellent 2.4% |
| Immigrants | Uruguay | 85.4 /100 | #140 | Excellent 2.4% |
| Alaska Natives | 84.5 /100 | #141 | Excellent 2.4% |
| Immigrants | Peru | 83.2 /100 | #142 | Excellent 2.4% |
| Afghans | 82.3 /100 | #143 | Excellent 2.4% |
| Costa Ricans | 80.8 /100 | #144 | Excellent 2.4% |
| Germans | 80.1 /100 | #145 | Excellent 2.4% |
| Israelis | 80.0 /100 | #146 | Good 2.4% |
| Dutch | 77.5 /100 | #147 | Good 2.4% |
| Romanians | 75.8 /100 | #148 | Good 2.4% |
| Arabs | 75.7 /100 | #149 | Good 2.4% |
| Immigrants | Costa Rica | 75.1 /100 | #150 | Good 2.4% |
| Basques | 74.0 /100 | #151 | Good 2.4% |
| Tlingit-Haida | 73.5 /100 | #152 | Good 2.4% |