Immigrants from Korea vs Fijian Self-Care Disability
COMPARE
Immigrants from Korea
Fijian
Self-Care Disability
Self-Care Disability Comparison
Immigrants from Korea
Fijians
2.3%
SELF-CARE DISABILITY
99.9/ 100
METRIC RATING
33rd/ 347
METRIC RANK
2.7%
SELF-CARE DISABILITY
0.0/ 100
METRIC RATING
284th/ 347
METRIC RANK
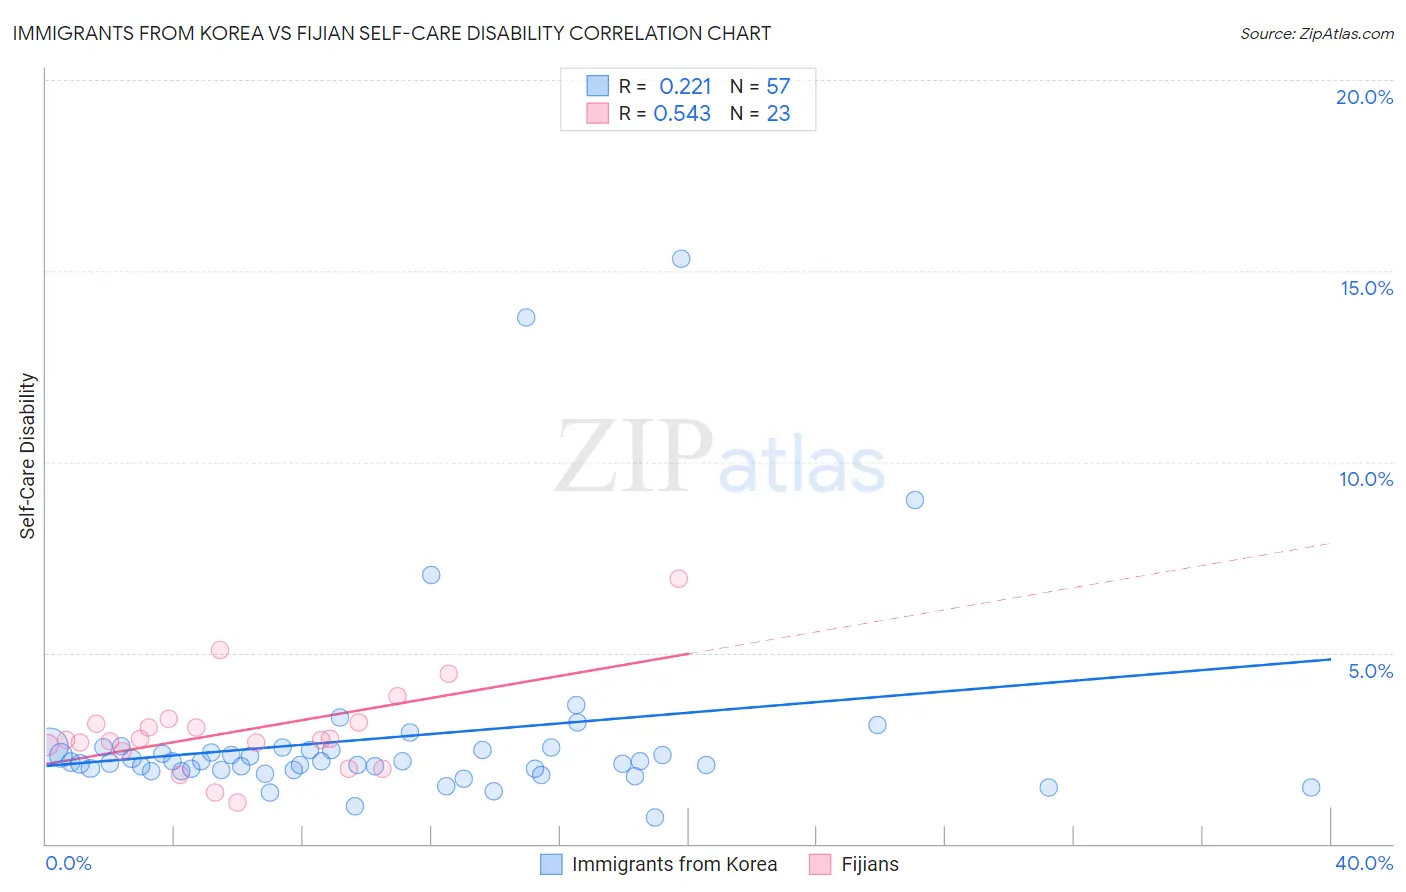
Immigrants from Korea vs Fijian Self-Care Disability Correlation Chart
The statistical analysis conducted on geographies consisting of 415,570,089 people shows a weak positive correlation between the proportion of Immigrants from Korea and percentage of population with self-care disability in the United States with a correlation coefficient (R) of 0.221 and weighted average of 2.3%. Similarly, the statistical analysis conducted on geographies consisting of 55,939,234 people shows a substantial positive correlation between the proportion of Fijians and percentage of population with self-care disability in the United States with a correlation coefficient (R) of 0.543 and weighted average of 2.7%, a difference of 19.1%.
Self-Care Disability Correlation Summary
| Measurement | Immigrants from Korea | Fijian |
| Minimum | 0.68% | 1.1% |
| Maximum | 15.3% | 7.0% |
| Range | 14.6% | 5.9% |
| Mean | 2.8% | 3.0% |
| Median | 2.1% | 2.7% |
| Interquartile 25% (IQ1) | 1.9% | 2.4% |
| Interquartile 75% (IQ3) | 2.5% | 3.2% |
| Interquartile Range (IQR) | 0.57% | 0.75% |
| Standard Deviation (Sample) | 2.6% | 1.2% |
| Standard Deviation (Population) | 2.6% | 1.2% |
Similar Demographics by Self-Care Disability
Demographics Similar to Immigrants from Korea by Self-Care Disability
In terms of self-care disability, the demographic groups most similar to Immigrants from Korea are Immigrants from Turkey (2.3%, a difference of 0.060%), Immigrants from Australia (2.3%, a difference of 0.12%), Immigrants from Lithuania (2.3%, a difference of 0.13%), Burmese (2.3%, a difference of 0.23%), and Danish (2.3%, a difference of 0.30%).
| Demographics | Rating | Rank | Self-Care Disability |
| Immigrants | Sri Lanka | 99.9 /100 | #26 | Exceptional 2.2% |
| Venezuelans | 99.9 /100 | #27 | Exceptional 2.2% |
| Inupiat | 99.9 /100 | #28 | Exceptional 2.2% |
| Immigrants | Zimbabwe | 99.9 /100 | #29 | Exceptional 2.3% |
| Paraguayans | 99.9 /100 | #30 | Exceptional 2.3% |
| Danes | 99.9 /100 | #31 | Exceptional 2.3% |
| Burmese | 99.9 /100 | #32 | Exceptional 2.3% |
| Immigrants | Korea | 99.9 /100 | #33 | Exceptional 2.3% |
| Immigrants | Turkey | 99.9 /100 | #34 | Exceptional 2.3% |
| Immigrants | Australia | 99.9 /100 | #35 | Exceptional 2.3% |
| Immigrants | Lithuania | 99.9 /100 | #36 | Exceptional 2.3% |
| Immigrants | Sweden | 99.9 /100 | #37 | Exceptional 2.3% |
| Immigrants | Eastern Africa | 99.9 /100 | #38 | Exceptional 2.3% |
| Immigrants | Bulgaria | 99.8 /100 | #39 | Exceptional 2.3% |
| Iranians | 99.8 /100 | #40 | Exceptional 2.3% |
Demographics Similar to Fijians by Self-Care Disability
In terms of self-care disability, the demographic groups most similar to Fijians are Jamaican (2.7%, a difference of 0.040%), Delaware (2.7%, a difference of 0.050%), Apache (2.7%, a difference of 0.12%), Immigrants from Iraq (2.7%, a difference of 0.13%), and Hispanic or Latino (2.7%, a difference of 0.29%).
| Demographics | Rating | Rank | Self-Care Disability |
| Immigrants | Ukraine | 0.1 /100 | #277 | Tragic 2.7% |
| Ottawa | 0.1 /100 | #278 | Tragic 2.7% |
| Iroquois | 0.1 /100 | #279 | Tragic 2.7% |
| Hispanics or Latinos | 0.1 /100 | #280 | Tragic 2.7% |
| Immigrants | Iraq | 0.0 /100 | #281 | Tragic 2.7% |
| Apache | 0.0 /100 | #282 | Tragic 2.7% |
| Delaware | 0.0 /100 | #283 | Tragic 2.7% |
| Fijians | 0.0 /100 | #284 | Tragic 2.7% |
| Jamaicans | 0.0 /100 | #285 | Tragic 2.7% |
| French American Indians | 0.0 /100 | #286 | Tragic 2.7% |
| Immigrants | Jamaica | 0.0 /100 | #287 | Tragic 2.7% |
| Immigrants | Barbados | 0.0 /100 | #288 | Tragic 2.7% |
| Africans | 0.0 /100 | #289 | Tragic 2.7% |
| Cubans | 0.0 /100 | #290 | Tragic 2.7% |
| Guyanese | 0.0 /100 | #291 | Tragic 2.7% |