Spanish vs German Self-Care Disability
COMPARE
Spanish
German
Self-Care Disability
Self-Care Disability Comparison
Spanish
Germans
2.6%
SELF-CARE DISABILITY
0.8/ 100
METRIC RATING
242nd/ 347
METRIC RANK
2.4%
SELF-CARE DISABILITY
80.1/ 100
METRIC RATING
145th/ 347
METRIC RANK
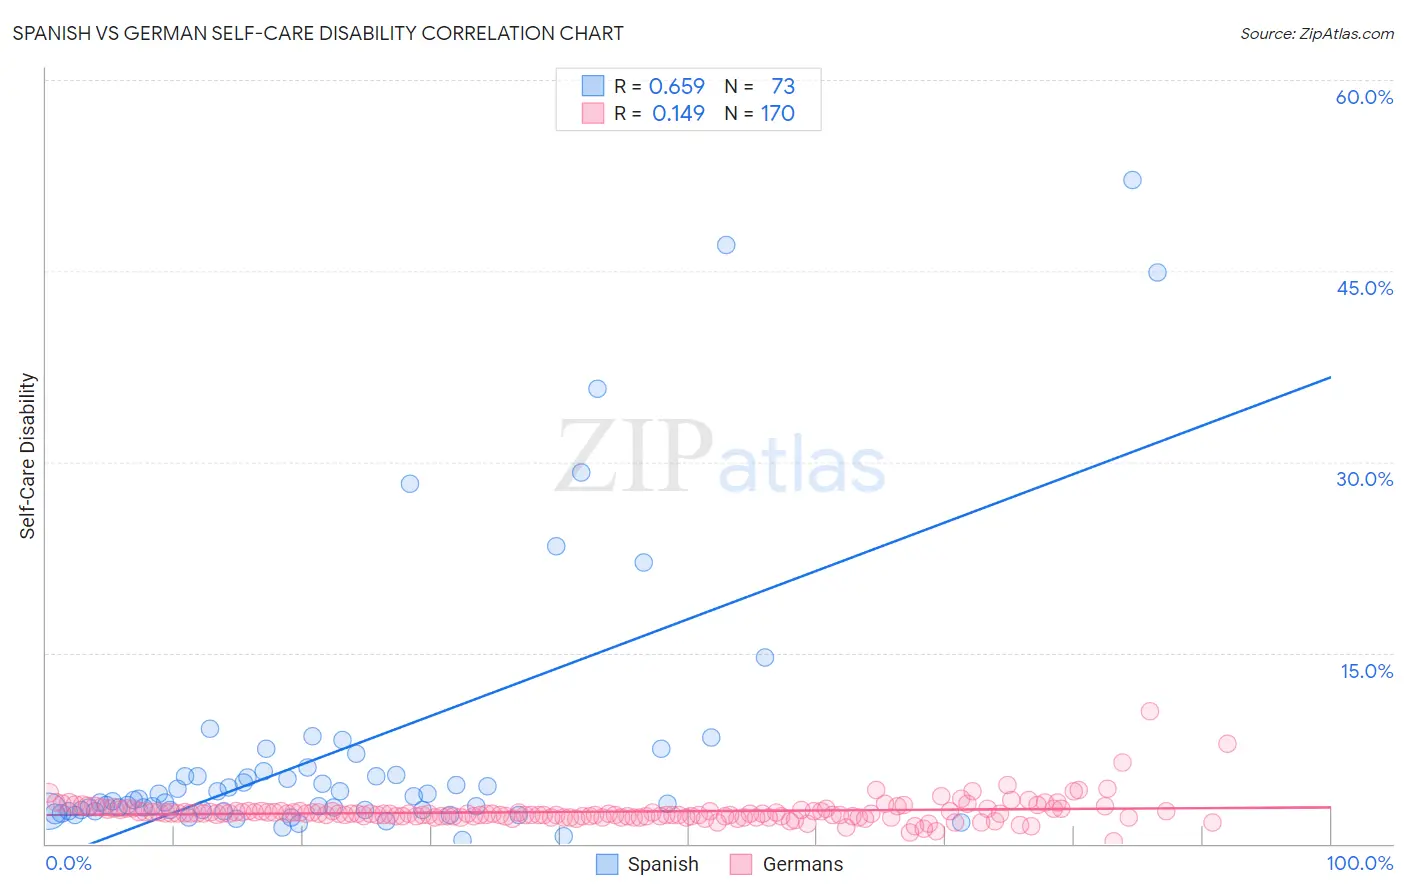
Spanish vs German Self-Care Disability Correlation Chart
The statistical analysis conducted on geographies consisting of 421,620,595 people shows a significant positive correlation between the proportion of Spanish and percentage of population with self-care disability in the United States with a correlation coefficient (R) of 0.659 and weighted average of 2.6%. Similarly, the statistical analysis conducted on geographies consisting of 577,887,813 people shows a poor positive correlation between the proportion of Germans and percentage of population with self-care disability in the United States with a correlation coefficient (R) of 0.149 and weighted average of 2.4%, a difference of 7.5%.
Self-Care Disability Correlation Summary
| Measurement | Spanish | German |
| Minimum | 0.33% | 0.20% |
| Maximum | 52.1% | 10.5% |
| Range | 51.8% | 10.3% |
| Mean | 7.4% | 2.5% |
| Median | 3.4% | 2.3% |
| Interquartile 25% (IQ1) | 2.6% | 2.1% |
| Interquartile 75% (IQ3) | 5.5% | 2.6% |
| Interquartile Range (IQR) | 2.9% | 0.42% |
| Standard Deviation (Sample) | 10.7% | 1.00% |
| Standard Deviation (Population) | 10.7% | 1.00% |
Similar Demographics by Self-Care Disability
Demographics Similar to Spanish by Self-Care Disability
In terms of self-care disability, the demographic groups most similar to Spanish are Hawaiian (2.6%, a difference of 0.070%), Yuman (2.6%, a difference of 0.11%), Immigrants from Syria (2.6%, a difference of 0.23%), Immigrants from Western Asia (2.6%, a difference of 0.30%), and Cheyenne (2.6%, a difference of 0.32%).
| Demographics | Rating | Rank | Self-Care Disability |
| Bahamians | 2.0 /100 | #235 | Tragic 2.6% |
| Bermudans | 1.9 /100 | #236 | Tragic 2.6% |
| Immigrants | Senegal | 1.6 /100 | #237 | Tragic 2.6% |
| Senegalese | 1.3 /100 | #238 | Tragic 2.6% |
| Immigrants | Panama | 1.2 /100 | #239 | Tragic 2.6% |
| Marshallese | 1.2 /100 | #240 | Tragic 2.6% |
| Immigrants | Syria | 1.0 /100 | #241 | Tragic 2.6% |
| Spanish | 0.8 /100 | #242 | Tragic 2.6% |
| Hawaiians | 0.8 /100 | #243 | Tragic 2.6% |
| Yuman | 0.8 /100 | #244 | Tragic 2.6% |
| Immigrants | Western Asia | 0.6 /100 | #245 | Tragic 2.6% |
| Cheyenne | 0.6 /100 | #246 | Tragic 2.6% |
| Immigrants | Albania | 0.6 /100 | #247 | Tragic 2.6% |
| Nicaraguans | 0.6 /100 | #248 | Tragic 2.6% |
| Mexican American Indians | 0.5 /100 | #249 | Tragic 2.6% |
Demographics Similar to Germans by Self-Care Disability
In terms of self-care disability, the demographic groups most similar to Germans are Israeli (2.4%, a difference of 0.010%), Costa Rican (2.4%, a difference of 0.050%), Afghan (2.4%, a difference of 0.17%), Dutch (2.4%, a difference of 0.19%), and Immigrants from Peru (2.4%, a difference of 0.25%).
| Demographics | Rating | Rank | Self-Care Disability |
| Immigrants | Croatia | 86.6 /100 | #138 | Excellent 2.4% |
| Sri Lankans | 86.6 /100 | #139 | Excellent 2.4% |
| Immigrants | Uruguay | 85.4 /100 | #140 | Excellent 2.4% |
| Alaska Natives | 84.5 /100 | #141 | Excellent 2.4% |
| Immigrants | Peru | 83.2 /100 | #142 | Excellent 2.4% |
| Afghans | 82.3 /100 | #143 | Excellent 2.4% |
| Costa Ricans | 80.8 /100 | #144 | Excellent 2.4% |
| Germans | 80.1 /100 | #145 | Excellent 2.4% |
| Israelis | 80.0 /100 | #146 | Good 2.4% |
| Dutch | 77.5 /100 | #147 | Good 2.4% |
| Romanians | 75.8 /100 | #148 | Good 2.4% |
| Arabs | 75.7 /100 | #149 | Good 2.4% |
| Immigrants | Costa Rica | 75.1 /100 | #150 | Good 2.4% |
| Basques | 74.0 /100 | #151 | Good 2.4% |
| Tlingit-Haida | 73.5 /100 | #152 | Good 2.4% |