Ugandan vs German Self-Care Disability
COMPARE
Ugandan
German
Self-Care Disability
Self-Care Disability Comparison
Ugandans
Germans
2.3%
SELF-CARE DISABILITY
98.8/ 100
METRIC RATING
81st/ 347
METRIC RANK
2.4%
SELF-CARE DISABILITY
80.1/ 100
METRIC RATING
145th/ 347
METRIC RANK
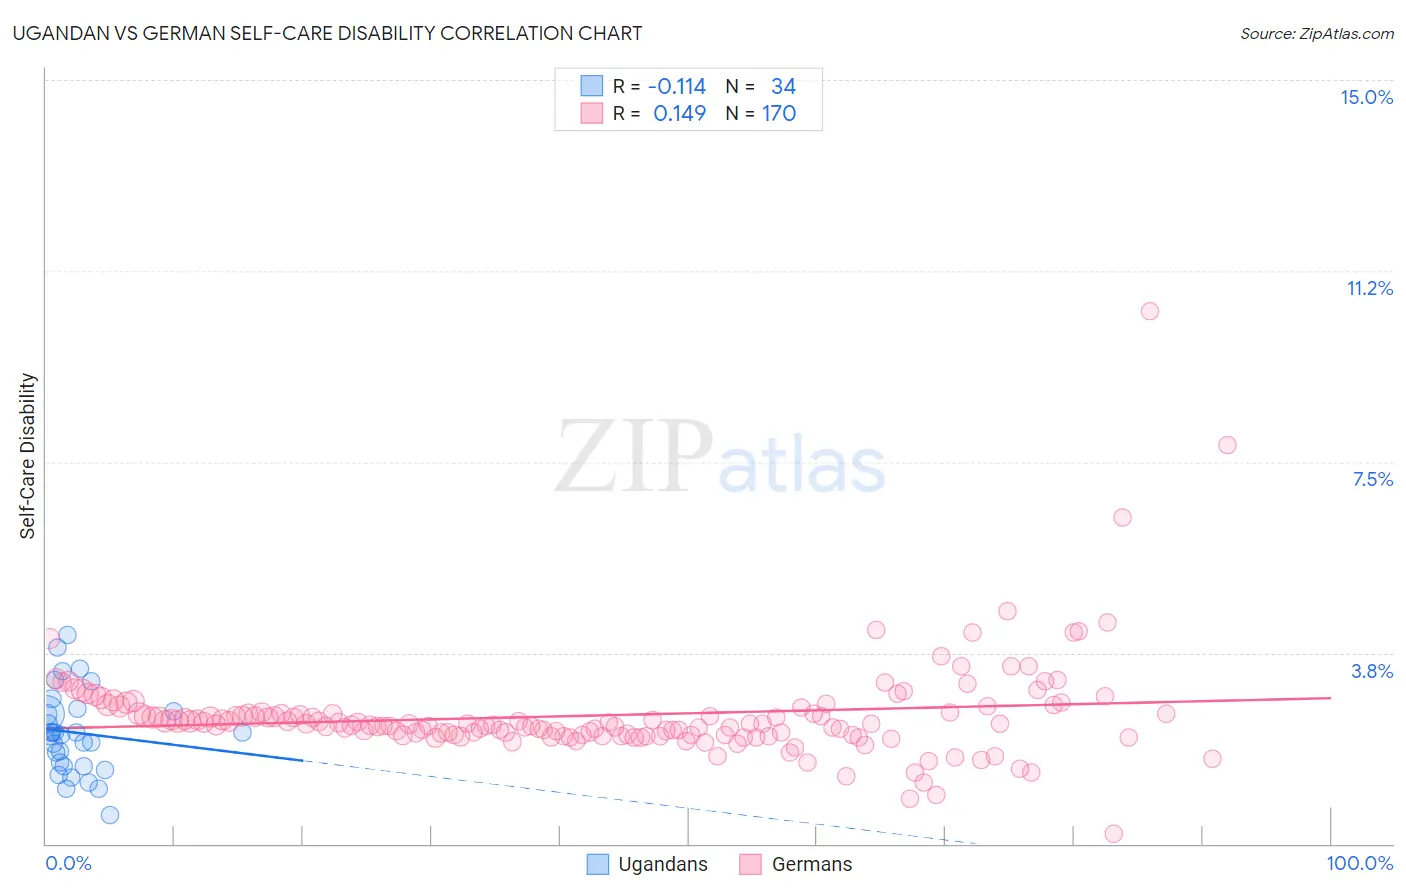
Ugandan vs German Self-Care Disability Correlation Chart
The statistical analysis conducted on geographies consisting of 93,977,399 people shows a poor negative correlation between the proportion of Ugandans and percentage of population with self-care disability in the United States with a correlation coefficient (R) of -0.114 and weighted average of 2.3%. Similarly, the statistical analysis conducted on geographies consisting of 577,887,813 people shows a poor positive correlation between the proportion of Germans and percentage of population with self-care disability in the United States with a correlation coefficient (R) of 0.149 and weighted average of 2.4%, a difference of 3.8%.
Self-Care Disability Correlation Summary
| Measurement | Ugandan | German |
| Minimum | 0.57% | 0.20% |
| Maximum | 4.1% | 10.5% |
| Range | 3.5% | 10.3% |
| Mean | 2.2% | 2.5% |
| Median | 2.2% | 2.3% |
| Interquartile 25% (IQ1) | 1.5% | 2.1% |
| Interquartile 75% (IQ3) | 2.6% | 2.6% |
| Interquartile Range (IQR) | 1.1% | 0.42% |
| Standard Deviation (Sample) | 0.82% | 1.00% |
| Standard Deviation (Population) | 0.81% | 1.00% |
Similar Demographics by Self-Care Disability
Demographics Similar to Ugandans by Self-Care Disability
In terms of self-care disability, the demographic groups most similar to Ugandans are Immigrants from Denmark (2.3%, a difference of 0.0%), Chilean (2.3%, a difference of 0.070%), Indian (Asian) (2.3%, a difference of 0.070%), Immigrants from Spain (2.3%, a difference of 0.11%), and Immigrants from Middle Africa (2.3%, a difference of 0.26%).
| Demographics | Rating | Rank | Self-Care Disability |
| Immigrants | Switzerland | 99.1 /100 | #74 | Exceptional 2.3% |
| Immigrants | Netherlands | 99.1 /100 | #75 | Exceptional 2.3% |
| Immigrants | China | 99.1 /100 | #76 | Exceptional 2.3% |
| Immigrants | Middle Africa | 99.0 /100 | #77 | Exceptional 2.3% |
| Immigrants | Ireland | 99.0 /100 | #78 | Exceptional 2.3% |
| Immigrants | Kenya | 99.0 /100 | #79 | Exceptional 2.3% |
| Chileans | 98.8 /100 | #80 | Exceptional 2.3% |
| Ugandans | 98.8 /100 | #81 | Exceptional 2.3% |
| Immigrants | Denmark | 98.8 /100 | #82 | Exceptional 2.3% |
| Indians (Asian) | 98.7 /100 | #83 | Exceptional 2.3% |
| Immigrants | Spain | 98.7 /100 | #84 | Exceptional 2.3% |
| Estonians | 98.3 /100 | #85 | Exceptional 2.3% |
| Immigrants | Northern Africa | 98.2 /100 | #86 | Exceptional 2.3% |
| Sierra Leoneans | 98.0 /100 | #87 | Exceptional 2.4% |
| Lithuanians | 98.0 /100 | #88 | Exceptional 2.4% |
Demographics Similar to Germans by Self-Care Disability
In terms of self-care disability, the demographic groups most similar to Germans are Israeli (2.4%, a difference of 0.010%), Costa Rican (2.4%, a difference of 0.050%), Afghan (2.4%, a difference of 0.17%), Dutch (2.4%, a difference of 0.19%), and Immigrants from Peru (2.4%, a difference of 0.25%).
| Demographics | Rating | Rank | Self-Care Disability |
| Immigrants | Croatia | 86.6 /100 | #138 | Excellent 2.4% |
| Sri Lankans | 86.6 /100 | #139 | Excellent 2.4% |
| Immigrants | Uruguay | 85.4 /100 | #140 | Excellent 2.4% |
| Alaska Natives | 84.5 /100 | #141 | Excellent 2.4% |
| Immigrants | Peru | 83.2 /100 | #142 | Excellent 2.4% |
| Afghans | 82.3 /100 | #143 | Excellent 2.4% |
| Costa Ricans | 80.8 /100 | #144 | Excellent 2.4% |
| Germans | 80.1 /100 | #145 | Excellent 2.4% |
| Israelis | 80.0 /100 | #146 | Good 2.4% |
| Dutch | 77.5 /100 | #147 | Good 2.4% |
| Romanians | 75.8 /100 | #148 | Good 2.4% |
| Arabs | 75.7 /100 | #149 | Good 2.4% |
| Immigrants | Costa Rica | 75.1 /100 | #150 | Good 2.4% |
| Basques | 74.0 /100 | #151 | Good 2.4% |
| Tlingit-Haida | 73.5 /100 | #152 | Good 2.4% |