Immigrants from Jordan vs Polish Male Disability
COMPARE
Immigrants from Jordan
Polish
Male Disability
Male Disability Comparison
Immigrants from Jordan
Poles
10.6%
MALE DISABILITY
98.4/ 100
METRIC RATING
80th/ 347
METRIC RANK
12.0%
MALE DISABILITY
0.7/ 100
METRIC RATING
248th/ 347
METRIC RANK
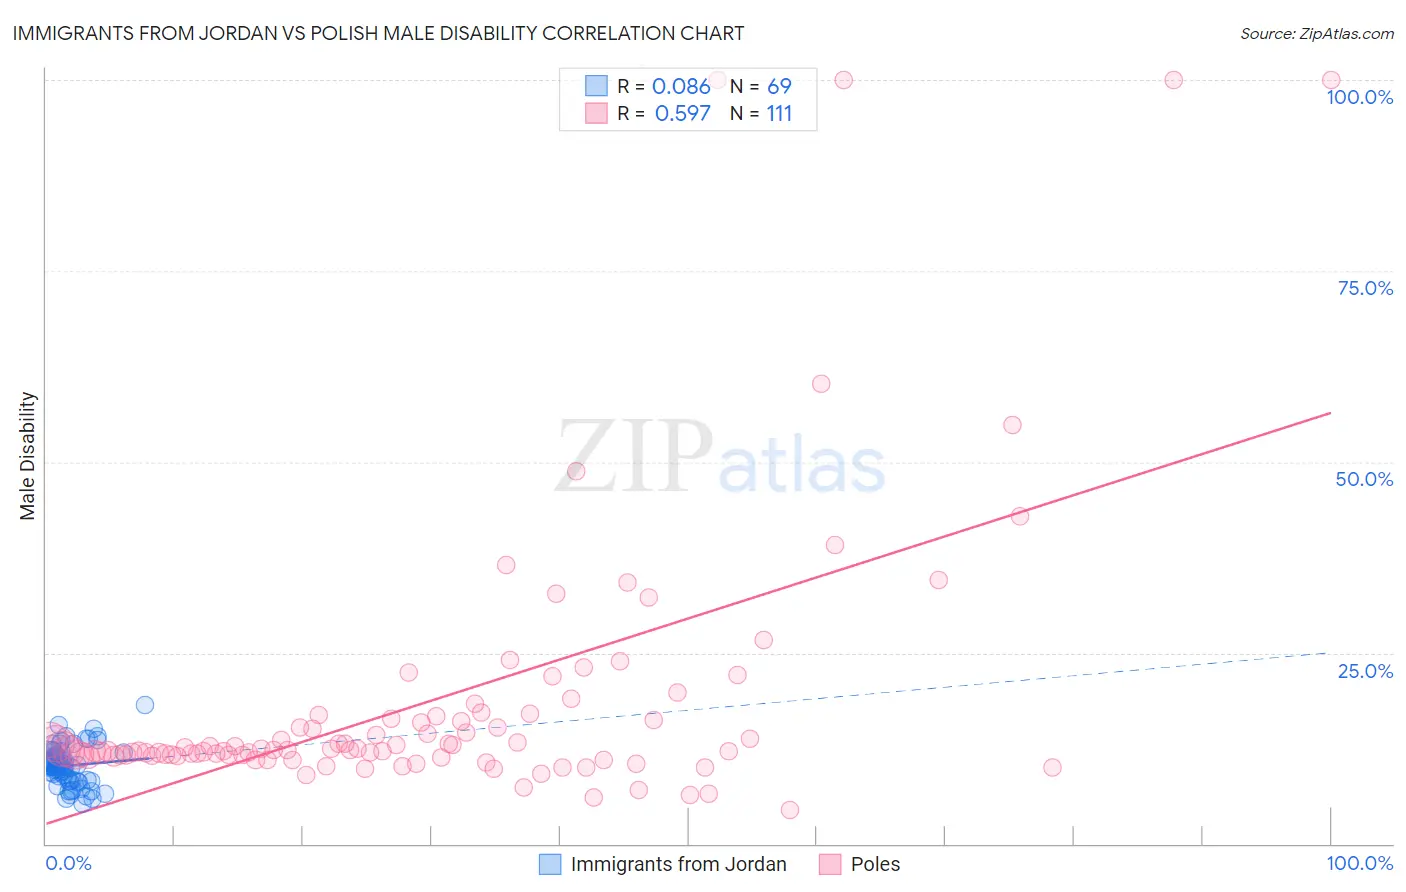
Immigrants from Jordan vs Polish Male Disability Correlation Chart
The statistical analysis conducted on geographies consisting of 181,276,340 people shows a slight positive correlation between the proportion of Immigrants from Jordan and percentage of males with a disability in the United States with a correlation coefficient (R) of 0.086 and weighted average of 10.6%. Similarly, the statistical analysis conducted on geographies consisting of 560,313,997 people shows a substantial positive correlation between the proportion of Poles and percentage of males with a disability in the United States with a correlation coefficient (R) of 0.597 and weighted average of 12.0%, a difference of 13.2%.
Male Disability Correlation Summary
| Measurement | Immigrants from Jordan | Polish |
| Minimum | 5.2% | 4.3% |
| Maximum | 18.2% | 100.0% |
| Range | 13.0% | 95.7% |
| Mean | 10.2% | 18.7% |
| Median | 10.2% | 12.3% |
| Interquartile 25% (IQ1) | 8.3% | 11.5% |
| Interquartile 75% (IQ3) | 11.5% | 16.7% |
| Interquartile Range (IQR) | 3.2% | 5.2% |
| Standard Deviation (Sample) | 2.5% | 18.4% |
| Standard Deviation (Population) | 2.5% | 18.3% |
Similar Demographics by Male Disability
Demographics Similar to Immigrants from Jordan by Male Disability
In terms of male disability, the demographic groups most similar to Immigrants from Jordan are Zimbabwean (10.6%, a difference of 0.020%), Immigrants from Chile (10.6%, a difference of 0.060%), Immigrants from Guyana (10.6%, a difference of 0.13%), Immigrants from Poland (10.6%, a difference of 0.19%), and Bulgarian (10.6%, a difference of 0.20%).
| Demographics | Rating | Rank | Male Disability |
| Immigrants | Lithuania | 98.9 /100 | #73 | Exceptional 10.5% |
| Immigrants | Lebanon | 98.8 /100 | #74 | Exceptional 10.5% |
| Sierra Leoneans | 98.7 /100 | #75 | Exceptional 10.5% |
| Immigrants | Sierra Leone | 98.7 /100 | #76 | Exceptional 10.5% |
| Laotians | 98.6 /100 | #77 | Exceptional 10.6% |
| Immigrants | Russia | 98.6 /100 | #78 | Exceptional 10.6% |
| Zimbabweans | 98.4 /100 | #79 | Exceptional 10.6% |
| Immigrants | Jordan | 98.4 /100 | #80 | Exceptional 10.6% |
| Immigrants | Chile | 98.3 /100 | #81 | Exceptional 10.6% |
| Immigrants | Guyana | 98.2 /100 | #82 | Exceptional 10.6% |
| Immigrants | Poland | 98.1 /100 | #83 | Exceptional 10.6% |
| Bulgarians | 98.1 /100 | #84 | Exceptional 10.6% |
| Sri Lankans | 97.9 /100 | #85 | Exceptional 10.6% |
| Immigrants | Ireland | 97.9 /100 | #86 | Exceptional 10.6% |
| Immigrants | Vietnam | 97.9 /100 | #87 | Exceptional 10.6% |
Demographics Similar to Poles by Male Disability
In terms of male disability, the demographic groups most similar to Poles are Hungarian (12.0%, a difference of 0.18%), Danish (11.9%, a difference of 0.36%), Immigrants from Yemen (12.0%, a difference of 0.36%), Immigrants from Laos (11.9%, a difference of 0.40%), and Immigrants from Liberia (11.9%, a difference of 0.40%).
| Demographics | Rating | Rank | Male Disability |
| Bahamians | 1.1 /100 | #241 | Tragic 11.9% |
| Northern Europeans | 1.1 /100 | #242 | Tragic 11.9% |
| Samoans | 1.1 /100 | #243 | Tragic 11.9% |
| Immigrants | Laos | 1.0 /100 | #244 | Tragic 11.9% |
| Immigrants | Liberia | 1.0 /100 | #245 | Tragic 11.9% |
| Danes | 0.9 /100 | #246 | Tragic 11.9% |
| Hungarians | 0.8 /100 | #247 | Tragic 12.0% |
| Poles | 0.7 /100 | #248 | Tragic 12.0% |
| Immigrants | Yemen | 0.5 /100 | #249 | Tragic 12.0% |
| Bangladeshis | 0.5 /100 | #250 | Tragic 12.0% |
| German Russians | 0.5 /100 | #251 | Tragic 12.0% |
| Slovenes | 0.5 /100 | #252 | Tragic 12.0% |
| Guamanians/Chamorros | 0.5 /100 | #253 | Tragic 12.0% |
| British | 0.4 /100 | #254 | Tragic 12.1% |
| Chinese | 0.4 /100 | #255 | Tragic 12.1% |