Immigrants from Jordan vs Paiute Male Disability
COMPARE
Immigrants from Jordan
Paiute
Male Disability
Male Disability Comparison
Immigrants from Jordan
Paiute
10.6%
MALE DISABILITY
98.4/ 100
METRIC RATING
80th/ 347
METRIC RANK
13.7%
MALE DISABILITY
0.0/ 100
METRIC RATING
317th/ 347
METRIC RANK
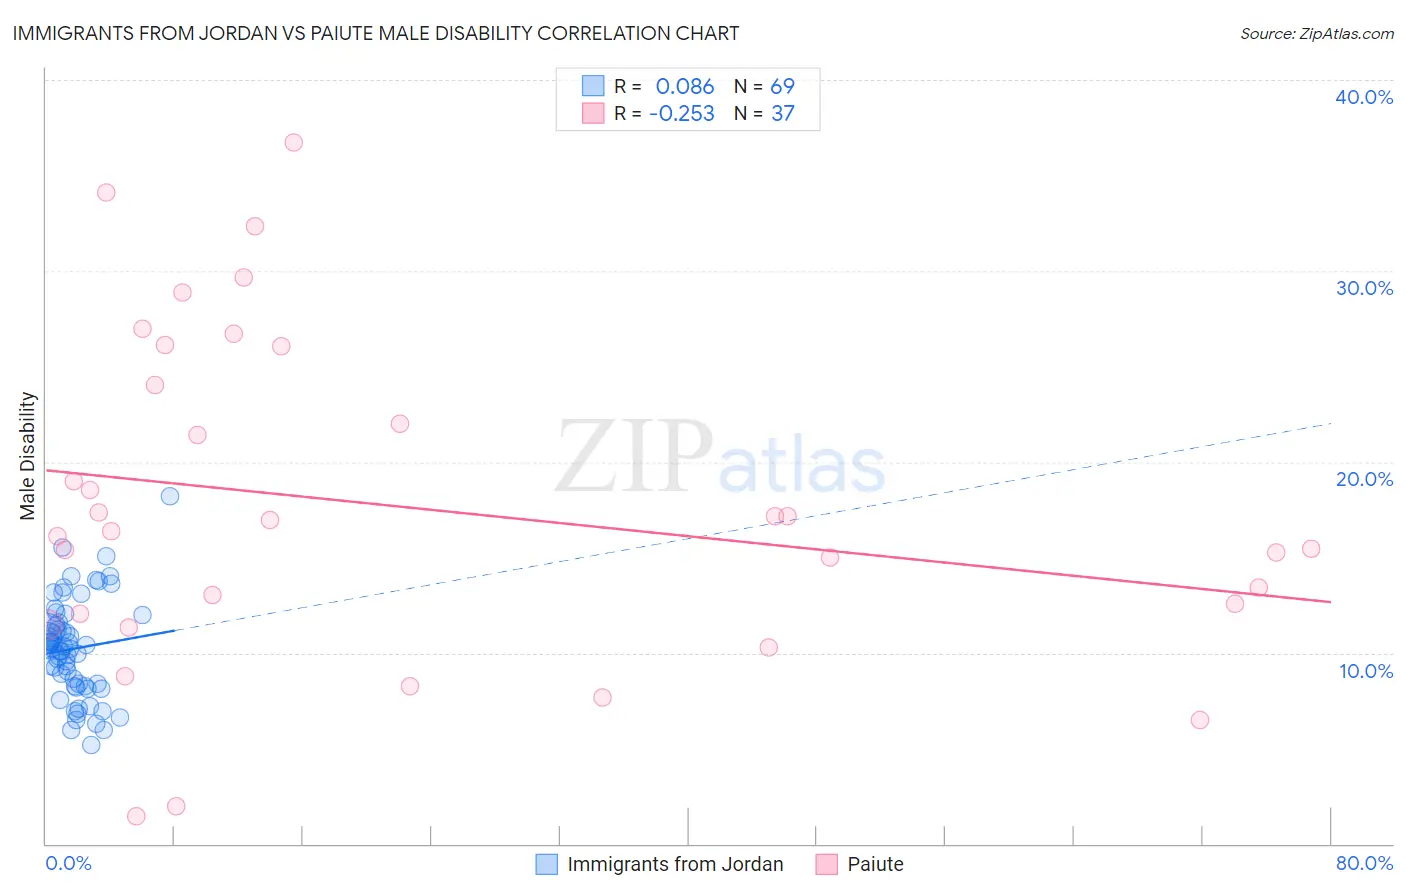
Immigrants from Jordan vs Paiute Male Disability Correlation Chart
The statistical analysis conducted on geographies consisting of 181,276,340 people shows a slight positive correlation between the proportion of Immigrants from Jordan and percentage of males with a disability in the United States with a correlation coefficient (R) of 0.086 and weighted average of 10.6%. Similarly, the statistical analysis conducted on geographies consisting of 58,394,227 people shows a weak negative correlation between the proportion of Paiute and percentage of males with a disability in the United States with a correlation coefficient (R) of -0.253 and weighted average of 13.7%, a difference of 29.4%.
Male Disability Correlation Summary
| Measurement | Immigrants from Jordan | Paiute |
| Minimum | 5.2% | 1.5% |
| Maximum | 18.2% | 36.7% |
| Range | 13.0% | 35.3% |
| Mean | 10.2% | 17.7% |
| Median | 10.2% | 16.4% |
| Interquartile 25% (IQ1) | 8.3% | 11.8% |
| Interquartile 75% (IQ3) | 11.5% | 25.0% |
| Interquartile Range (IQR) | 3.2% | 13.3% |
| Standard Deviation (Sample) | 2.5% | 8.6% |
| Standard Deviation (Population) | 2.5% | 8.5% |
Similar Demographics by Male Disability
Demographics Similar to Immigrants from Jordan by Male Disability
In terms of male disability, the demographic groups most similar to Immigrants from Jordan are Zimbabwean (10.6%, a difference of 0.020%), Immigrants from Chile (10.6%, a difference of 0.060%), Immigrants from Guyana (10.6%, a difference of 0.13%), Immigrants from Poland (10.6%, a difference of 0.19%), and Bulgarian (10.6%, a difference of 0.20%).
| Demographics | Rating | Rank | Male Disability |
| Immigrants | Lithuania | 98.9 /100 | #73 | Exceptional 10.5% |
| Immigrants | Lebanon | 98.8 /100 | #74 | Exceptional 10.5% |
| Sierra Leoneans | 98.7 /100 | #75 | Exceptional 10.5% |
| Immigrants | Sierra Leone | 98.7 /100 | #76 | Exceptional 10.5% |
| Laotians | 98.6 /100 | #77 | Exceptional 10.6% |
| Immigrants | Russia | 98.6 /100 | #78 | Exceptional 10.6% |
| Zimbabweans | 98.4 /100 | #79 | Exceptional 10.6% |
| Immigrants | Jordan | 98.4 /100 | #80 | Exceptional 10.6% |
| Immigrants | Chile | 98.3 /100 | #81 | Exceptional 10.6% |
| Immigrants | Guyana | 98.2 /100 | #82 | Exceptional 10.6% |
| Immigrants | Poland | 98.1 /100 | #83 | Exceptional 10.6% |
| Bulgarians | 98.1 /100 | #84 | Exceptional 10.6% |
| Sri Lankans | 97.9 /100 | #85 | Exceptional 10.6% |
| Immigrants | Ireland | 97.9 /100 | #86 | Exceptional 10.6% |
| Immigrants | Vietnam | 97.9 /100 | #87 | Exceptional 10.6% |
Demographics Similar to Paiute by Male Disability
In terms of male disability, the demographic groups most similar to Paiute are Cree (13.7%, a difference of 0.21%), American (13.8%, a difference of 0.62%), Alaska Native (13.6%, a difference of 0.80%), Iroquois (13.6%, a difference of 0.86%), and Aleut (13.5%, a difference of 1.0%).
| Demographics | Rating | Rank | Male Disability |
| Immigrants | Azores | 0.0 /100 | #310 | Tragic 13.4% |
| Delaware | 0.0 /100 | #311 | Tragic 13.5% |
| Yakama | 0.0 /100 | #312 | Tragic 13.5% |
| Puget Sound Salish | 0.0 /100 | #313 | Tragic 13.5% |
| Aleuts | 0.0 /100 | #314 | Tragic 13.5% |
| Iroquois | 0.0 /100 | #315 | Tragic 13.6% |
| Alaska Natives | 0.0 /100 | #316 | Tragic 13.6% |
| Paiute | 0.0 /100 | #317 | Tragic 13.7% |
| Cree | 0.0 /100 | #318 | Tragic 13.7% |
| Americans | 0.0 /100 | #319 | Tragic 13.8% |
| Tlingit-Haida | 0.0 /100 | #320 | Tragic 13.8% |
| Shoshone | 0.0 /100 | #321 | Tragic 13.8% |
| Apache | 0.0 /100 | #322 | Tragic 14.0% |
| Osage | 0.0 /100 | #323 | Tragic 14.0% |
| Comanche | 0.0 /100 | #324 | Tragic 14.1% |