Immigrants from Jordan vs English Nursery School
COMPARE
Immigrants from Jordan
English
Nursery School
Nursery School Comparison
Immigrants from Jordan
English
98.0%
NURSERY SCHOOL
53.4/ 100
METRIC RATING
171st/ 347
METRIC RANK
98.7%
NURSERY SCHOOL
100.0/ 100
METRIC RATING
13th/ 347
METRIC RANK
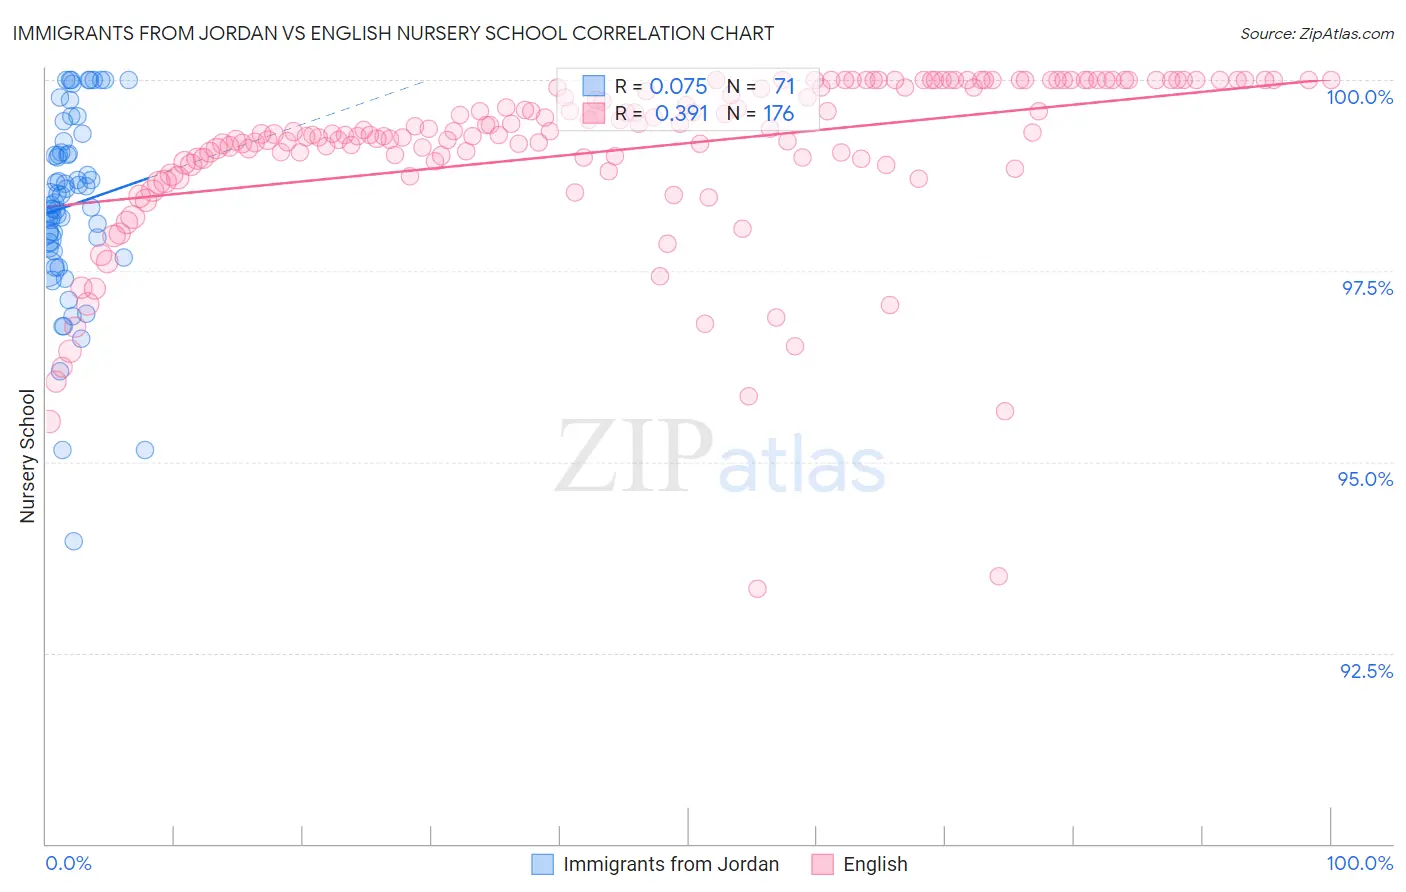
Immigrants from Jordan vs English Nursery School Correlation Chart
The statistical analysis conducted on geographies consisting of 181,269,915 people shows a slight positive correlation between the proportion of Immigrants from Jordan and percentage of population with at least nursery school education in the United States with a correlation coefficient (R) of 0.075 and weighted average of 98.0%. Similarly, the statistical analysis conducted on geographies consisting of 579,981,412 people shows a mild positive correlation between the proportion of English and percentage of population with at least nursery school education in the United States with a correlation coefficient (R) of 0.391 and weighted average of 98.7%, a difference of 0.71%.
Nursery School Correlation Summary
| Measurement | Immigrants from Jordan | English |
| Minimum | 94.0% | 93.3% |
| Maximum | 100.0% | 100.0% |
| Range | 6.0% | 6.7% |
| Mean | 98.4% | 99.1% |
| Median | 98.4% | 99.3% |
| Interquartile 25% (IQ1) | 97.8% | 99.0% |
| Interquartile 75% (IQ3) | 99.1% | 100.0% |
| Interquartile Range (IQR) | 1.3% | 1.0% |
| Standard Deviation (Sample) | 1.2% | 1.1% |
| Standard Deviation (Population) | 1.2% | 1.1% |
Similar Demographics by Nursery School
Demographics Similar to Immigrants from Jordan by Nursery School
In terms of nursery school, the demographic groups most similar to Immigrants from Jordan are Immigrants from Korea (98.0%, a difference of 0.0%), Bermudan (98.0%, a difference of 0.0%), Ugandan (98.0%, a difference of 0.010%), Chilean (98.0%, a difference of 0.010%), and Spanish American (98.0%, a difference of 0.010%).
| Demographics | Rating | Rank | Nursery School |
| Ugandans | 56.4 /100 | #164 | Average 98.0% |
| Chileans | 56.4 /100 | #165 | Average 98.0% |
| Spanish Americans | 55.6 /100 | #166 | Average 98.0% |
| Immigrants | Spain | 55.6 /100 | #167 | Average 98.0% |
| Immigrants | Micronesia | 55.0 /100 | #168 | Average 98.0% |
| Immigrants | Korea | 53.8 /100 | #169 | Average 98.0% |
| Bermudans | 53.7 /100 | #170 | Average 98.0% |
| Immigrants | Jordan | 53.4 /100 | #171 | Average 98.0% |
| Immigrants | Brazil | 51.3 /100 | #172 | Average 98.0% |
| Kenyans | 50.2 /100 | #173 | Average 98.0% |
| Navajo | 50.0 /100 | #174 | Average 98.0% |
| Immigrants | Sri Lanka | 49.9 /100 | #175 | Average 98.0% |
| Immigrants | Venezuela | 49.8 /100 | #176 | Average 98.0% |
| Albanians | 48.9 /100 | #177 | Average 98.0% |
| Natives/Alaskans | 48.6 /100 | #178 | Average 98.0% |
Demographics Similar to English by Nursery School
In terms of nursery school, the demographic groups most similar to English are Carpatho Rusyn (98.7%, a difference of 0.0%), Swedish (98.7%, a difference of 0.010%), Slovene (98.7%, a difference of 0.020%), Tlingit-Haida (98.7%, a difference of 0.030%), and Scottish (98.7%, a difference of 0.030%).
| Demographics | Rating | Rank | Nursery School |
| Alaskan Athabascans | 100.0 /100 | #6 | Exceptional 98.8% |
| Alaska Natives | 100.0 /100 | #7 | Exceptional 98.8% |
| Norwegians | 100.0 /100 | #8 | Exceptional 98.7% |
| Slovaks | 100.0 /100 | #9 | Exceptional 98.7% |
| Germans | 100.0 /100 | #10 | Exceptional 98.7% |
| Tlingit-Haida | 100.0 /100 | #11 | Exceptional 98.7% |
| Slovenes | 100.0 /100 | #12 | Exceptional 98.7% |
| English | 100.0 /100 | #13 | Exceptional 98.7% |
| Carpatho Rusyns | 100.0 /100 | #14 | Exceptional 98.7% |
| Swedes | 100.0 /100 | #15 | Exceptional 98.7% |
| Scottish | 100.0 /100 | #16 | Exceptional 98.7% |
| Aleuts | 100.0 /100 | #17 | Exceptional 98.7% |
| Dutch | 100.0 /100 | #18 | Exceptional 98.7% |
| Irish | 100.0 /100 | #19 | Exceptional 98.6% |
| Pennsylvania Germans | 100.0 /100 | #20 | Exceptional 98.6% |