Immigrants from Jordan vs English Self-Care Disability
COMPARE
Immigrants from Jordan
English
Self-Care Disability
Self-Care Disability Comparison
Immigrants from Jordan
English
2.4%
SELF-CARE DISABILITY
97.7/ 100
METRIC RATING
91st/ 347
METRIC RANK
2.5%
SELF-CARE DISABILITY
46.2/ 100
METRIC RATING
178th/ 347
METRIC RANK
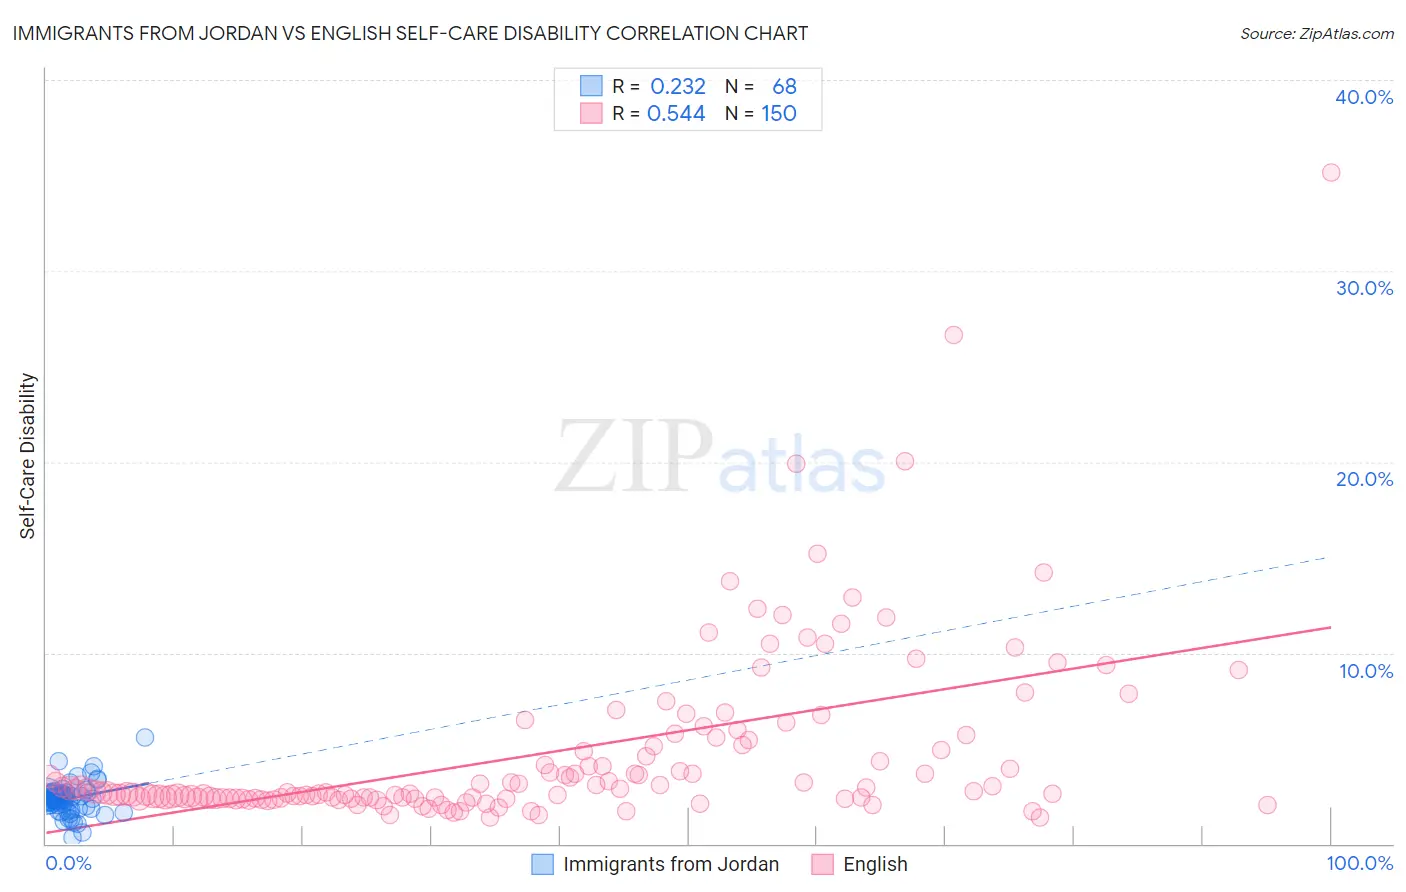
Immigrants from Jordan vs English Self-Care Disability Correlation Chart
The statistical analysis conducted on geographies consisting of 181,224,885 people shows a weak positive correlation between the proportion of Immigrants from Jordan and percentage of population with self-care disability in the United States with a correlation coefficient (R) of 0.232 and weighted average of 2.4%. Similarly, the statistical analysis conducted on geographies consisting of 576,680,269 people shows a substantial positive correlation between the proportion of English and percentage of population with self-care disability in the United States with a correlation coefficient (R) of 0.544 and weighted average of 2.5%, a difference of 4.9%.
Self-Care Disability Correlation Summary
| Measurement | Immigrants from Jordan | English |
| Minimum | 0.35% | 1.4% |
| Maximum | 5.6% | 35.1% |
| Range | 5.2% | 33.8% |
| Mean | 2.4% | 4.7% |
| Median | 2.4% | 2.7% |
| Interquartile 25% (IQ1) | 2.0% | 2.4% |
| Interquartile 75% (IQ3) | 2.6% | 5.2% |
| Interquartile Range (IQR) | 0.64% | 2.8% |
| Standard Deviation (Sample) | 0.80% | 4.7% |
| Standard Deviation (Population) | 0.80% | 4.7% |
Similar Demographics by Self-Care Disability
Demographics Similar to Immigrants from Jordan by Self-Care Disability
In terms of self-care disability, the demographic groups most similar to Immigrants from Jordan are Immigrants from Czechoslovakia (2.4%, a difference of 0.010%), Icelander (2.4%, a difference of 0.14%), Immigrants from Congo (2.4%, a difference of 0.15%), Sierra Leonean (2.4%, a difference of 0.20%), and Lithuanian (2.4%, a difference of 0.20%).
| Demographics | Rating | Rank | Self-Care Disability |
| Immigrants | Spain | 98.7 /100 | #84 | Exceptional 2.3% |
| Estonians | 98.3 /100 | #85 | Exceptional 2.3% |
| Immigrants | Northern Africa | 98.2 /100 | #86 | Exceptional 2.3% |
| Sierra Leoneans | 98.0 /100 | #87 | Exceptional 2.4% |
| Lithuanians | 98.0 /100 | #88 | Exceptional 2.4% |
| Immigrants | Congo | 98.0 /100 | #89 | Exceptional 2.4% |
| Immigrants | Czechoslovakia | 97.7 /100 | #90 | Exceptional 2.4% |
| Immigrants | Jordan | 97.7 /100 | #91 | Exceptional 2.4% |
| Icelanders | 97.4 /100 | #92 | Exceptional 2.4% |
| Immigrants | Latvia | 97.0 /100 | #93 | Exceptional 2.4% |
| Macedonians | 96.9 /100 | #94 | Exceptional 2.4% |
| Immigrants | Asia | 96.9 /100 | #95 | Exceptional 2.4% |
| Immigrants | Chile | 96.7 /100 | #96 | Exceptional 2.4% |
| Swiss | 96.6 /100 | #97 | Exceptional 2.4% |
| Immigrants | Poland | 96.4 /100 | #98 | Exceptional 2.4% |
Demographics Similar to English by Self-Care Disability
In terms of self-care disability, the demographic groups most similar to English are Immigrants from Kazakhstan (2.5%, a difference of 0.020%), Hungarian (2.5%, a difference of 0.030%), Immigrants from Afghanistan (2.5%, a difference of 0.070%), Immigrants from Bosnia and Herzegovina (2.5%, a difference of 0.16%), and Welsh (2.5%, a difference of 0.18%).
| Demographics | Rating | Rank | Self-Care Disability |
| Pennsylvania Germans | 53.5 /100 | #171 | Average 2.5% |
| Czechoslovakians | 53.5 /100 | #172 | Average 2.5% |
| Immigrants | Burma/Myanmar | 52.8 /100 | #173 | Average 2.5% |
| Welsh | 50.0 /100 | #174 | Average 2.5% |
| Immigrants | Bosnia and Herzegovina | 49.6 /100 | #175 | Average 2.5% |
| Immigrants | Afghanistan | 47.6 /100 | #176 | Average 2.5% |
| Immigrants | Kazakhstan | 46.7 /100 | #177 | Average 2.5% |
| English | 46.2 /100 | #178 | Average 2.5% |
| Hungarians | 45.5 /100 | #179 | Average 2.5% |
| Indonesians | 41.2 /100 | #180 | Average 2.5% |
| Ghanaians | 40.4 /100 | #181 | Average 2.5% |
| Maltese | 37.5 /100 | #182 | Fair 2.5% |
| Salvadorans | 36.4 /100 | #183 | Fair 2.5% |
| Yugoslavians | 36.1 /100 | #184 | Fair 2.5% |
| Slavs | 34.3 /100 | #185 | Fair 2.5% |