Immigrants from Jordan vs Costa Rican Male Disability
COMPARE
Immigrants from Jordan
Costa Rican
Male Disability
Male Disability Comparison
Immigrants from Jordan
Costa Ricans
10.6%
MALE DISABILITY
98.4/ 100
METRIC RATING
80th/ 347
METRIC RANK
11.0%
MALE DISABILITY
78.0/ 100
METRIC RATING
145th/ 347
METRIC RANK
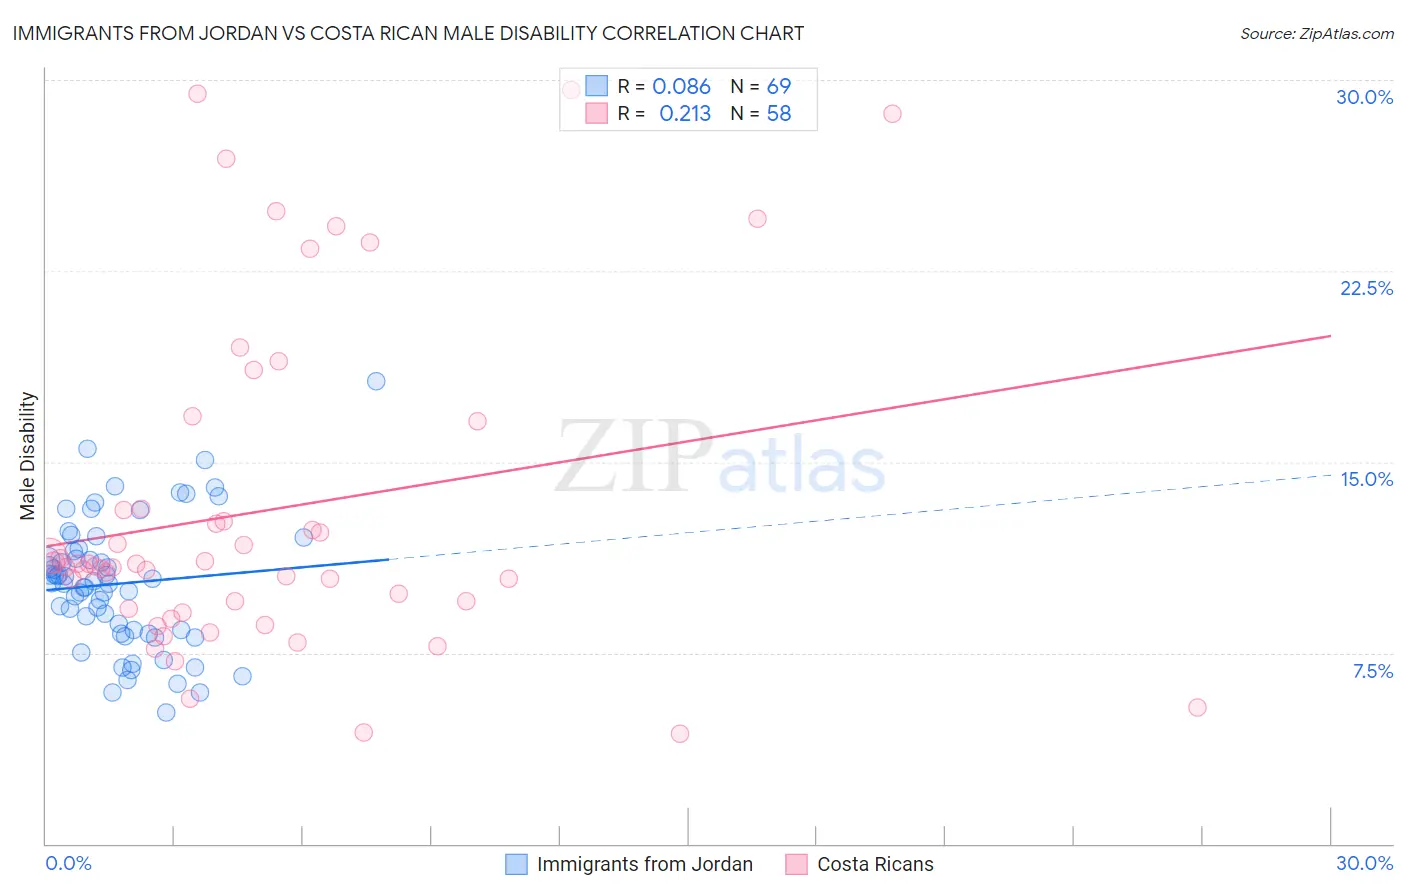
Immigrants from Jordan vs Costa Rican Male Disability Correlation Chart
The statistical analysis conducted on geographies consisting of 181,276,340 people shows a slight positive correlation between the proportion of Immigrants from Jordan and percentage of males with a disability in the United States with a correlation coefficient (R) of 0.086 and weighted average of 10.6%. Similarly, the statistical analysis conducted on geographies consisting of 253,572,614 people shows a weak positive correlation between the proportion of Costa Ricans and percentage of males with a disability in the United States with a correlation coefficient (R) of 0.213 and weighted average of 11.0%, a difference of 4.2%.
Male Disability Correlation Summary
| Measurement | Immigrants from Jordan | Costa Rican |
| Minimum | 5.2% | 4.3% |
| Maximum | 18.2% | 29.6% |
| Range | 13.0% | 25.3% |
| Mean | 10.2% | 13.1% |
| Median | 10.2% | 11.0% |
| Interquartile 25% (IQ1) | 8.3% | 9.2% |
| Interquartile 75% (IQ3) | 11.5% | 13.1% |
| Interquartile Range (IQR) | 3.2% | 3.9% |
| Standard Deviation (Sample) | 2.5% | 6.5% |
| Standard Deviation (Population) | 2.5% | 6.4% |
Similar Demographics by Male Disability
Demographics Similar to Immigrants from Jordan by Male Disability
In terms of male disability, the demographic groups most similar to Immigrants from Jordan are Zimbabwean (10.6%, a difference of 0.020%), Immigrants from Chile (10.6%, a difference of 0.060%), Immigrants from Guyana (10.6%, a difference of 0.13%), Immigrants from Poland (10.6%, a difference of 0.19%), and Bulgarian (10.6%, a difference of 0.20%).
| Demographics | Rating | Rank | Male Disability |
| Immigrants | Lithuania | 98.9 /100 | #73 | Exceptional 10.5% |
| Immigrants | Lebanon | 98.8 /100 | #74 | Exceptional 10.5% |
| Sierra Leoneans | 98.7 /100 | #75 | Exceptional 10.5% |
| Immigrants | Sierra Leone | 98.7 /100 | #76 | Exceptional 10.5% |
| Laotians | 98.6 /100 | #77 | Exceptional 10.6% |
| Immigrants | Russia | 98.6 /100 | #78 | Exceptional 10.6% |
| Zimbabweans | 98.4 /100 | #79 | Exceptional 10.6% |
| Immigrants | Jordan | 98.4 /100 | #80 | Exceptional 10.6% |
| Immigrants | Chile | 98.3 /100 | #81 | Exceptional 10.6% |
| Immigrants | Guyana | 98.2 /100 | #82 | Exceptional 10.6% |
| Immigrants | Poland | 98.1 /100 | #83 | Exceptional 10.6% |
| Bulgarians | 98.1 /100 | #84 | Exceptional 10.6% |
| Sri Lankans | 97.9 /100 | #85 | Exceptional 10.6% |
| Immigrants | Ireland | 97.9 /100 | #86 | Exceptional 10.6% |
| Immigrants | Vietnam | 97.9 /100 | #87 | Exceptional 10.6% |
Demographics Similar to Costa Ricans by Male Disability
In terms of male disability, the demographic groups most similar to Costa Ricans are Kenyan (11.0%, a difference of 0.010%), Korean (11.0%, a difference of 0.040%), Immigrants from Croatia (11.0%, a difference of 0.060%), Sudanese (11.0%, a difference of 0.070%), and Immigrants from Denmark (11.0%, a difference of 0.13%).
| Demographics | Rating | Rank | Male Disability |
| Nigerians | 81.9 /100 | #138 | Excellent 11.0% |
| South Africans | 81.7 /100 | #139 | Excellent 11.0% |
| Immigrants | Italy | 81.5 /100 | #140 | Excellent 11.0% |
| Arabs | 81.5 /100 | #141 | Excellent 11.0% |
| Immigrants | Sudan | 81.5 /100 | #142 | Excellent 11.0% |
| Moroccans | 80.7 /100 | #143 | Excellent 11.0% |
| Kenyans | 78.1 /100 | #144 | Good 11.0% |
| Costa Ricans | 78.0 /100 | #145 | Good 11.0% |
| Koreans | 77.5 /100 | #146 | Good 11.0% |
| Immigrants | Croatia | 77.3 /100 | #147 | Good 11.0% |
| Sudanese | 77.1 /100 | #148 | Good 11.0% |
| Immigrants | Denmark | 76.4 /100 | #149 | Good 11.0% |
| Immigrants | Guatemala | 75.1 /100 | #150 | Good 11.0% |
| Cubans | 74.9 /100 | #151 | Good 11.0% |
| Immigrants | Albania | 74.4 /100 | #152 | Good 11.0% |