Immigrants from Jamaica vs Immigrants from Eritrea Disability Age 5 to 17
COMPARE
Immigrants from Jamaica
Immigrants from Eritrea
Disability Age 5 to 17
Disability Age 5 to 17 Comparison
Immigrants from Jamaica
Immigrants from Eritrea
6.1%
DISABILITY AGE 5 TO 17
0.1/ 100
METRIC RATING
279th/ 347
METRIC RANK
5.3%
DISABILITY AGE 5 TO 17
98.0/ 100
METRIC RATING
110th/ 347
METRIC RANK
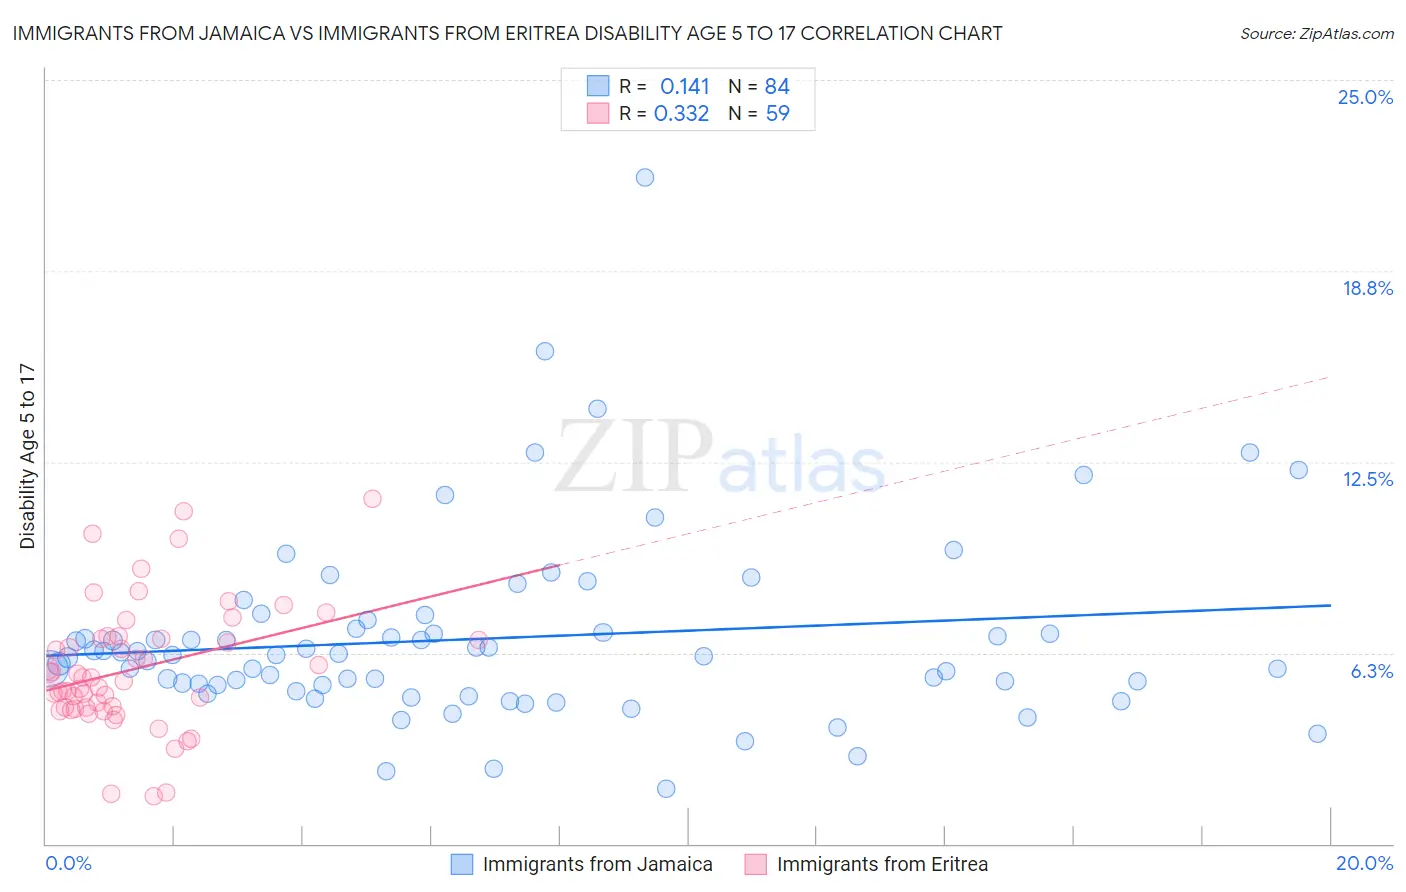
Immigrants from Jamaica vs Immigrants from Eritrea Disability Age 5 to 17 Correlation Chart
The statistical analysis conducted on geographies consisting of 299,987,065 people shows a poor positive correlation between the proportion of Immigrants from Jamaica and percentage of population with a disability between the ages 5 and 17 in the United States with a correlation coefficient (R) of 0.141 and weighted average of 6.1%. Similarly, the statistical analysis conducted on geographies consisting of 104,672,800 people shows a mild positive correlation between the proportion of Immigrants from Eritrea and percentage of population with a disability between the ages 5 and 17 in the United States with a correlation coefficient (R) of 0.332 and weighted average of 5.3%, a difference of 14.6%.
Disability Age 5 to 17 Correlation Summary
| Measurement | Immigrants from Jamaica | Immigrants from Eritrea |
| Minimum | 1.8% | 1.5% |
| Maximum | 21.8% | 11.3% |
| Range | 20.0% | 9.8% |
| Mean | 6.7% | 5.7% |
| Median | 6.2% | 5.4% |
| Interquartile 25% (IQ1) | 5.2% | 4.4% |
| Interquartile 75% (IQ3) | 7.0% | 6.7% |
| Interquartile Range (IQR) | 1.8% | 2.3% |
| Standard Deviation (Sample) | 3.1% | 2.0% |
| Standard Deviation (Population) | 3.0% | 2.0% |
Similar Demographics by Disability Age 5 to 17
Demographics Similar to Immigrants from Jamaica by Disability Age 5 to 17
In terms of disability age 5 to 17, the demographic groups most similar to Immigrants from Jamaica are Immigrants from Liberia (6.1%, a difference of 0.14%), Portuguese (6.1%, a difference of 0.14%), Puget Sound Salish (6.1%, a difference of 0.22%), Scottish (6.1%, a difference of 0.39%), and German (6.1%, a difference of 0.64%).
| Demographics | Rating | Rank | Disability Age 5 to 17 |
| Finns | 0.2 /100 | #272 | Tragic 6.0% |
| Alaska Natives | 0.2 /100 | #273 | Tragic 6.0% |
| Cheyenne | 0.2 /100 | #274 | Tragic 6.0% |
| Dutch | 0.2 /100 | #275 | Tragic 6.0% |
| Japanese | 0.1 /100 | #276 | Tragic 6.1% |
| Puget Sound Salish | 0.1 /100 | #277 | Tragic 6.1% |
| Immigrants | Liberia | 0.1 /100 | #278 | Tragic 6.1% |
| Immigrants | Jamaica | 0.1 /100 | #279 | Tragic 6.1% |
| Portuguese | 0.1 /100 | #280 | Tragic 6.1% |
| Scottish | 0.0 /100 | #281 | Tragic 6.1% |
| Germans | 0.0 /100 | #282 | Tragic 6.1% |
| Ugandans | 0.0 /100 | #283 | Tragic 6.2% |
| Sub-Saharan Africans | 0.0 /100 | #284 | Tragic 6.2% |
| English | 0.0 /100 | #285 | Tragic 6.2% |
| Colville | 0.0 /100 | #286 | Tragic 6.2% |
Demographics Similar to Immigrants from Eritrea by Disability Age 5 to 17
In terms of disability age 5 to 17, the demographic groups most similar to Immigrants from Eritrea are Immigrants from Northern Africa (5.3%, a difference of 0.040%), Ethiopian (5.3%, a difference of 0.040%), Immigrants from Latvia (5.3%, a difference of 0.050%), Immigrants from South Africa (5.3%, a difference of 0.080%), and Aleut (5.3%, a difference of 0.10%).
| Demographics | Rating | Rank | Disability Age 5 to 17 |
| Salvadorans | 98.6 /100 | #103 | Exceptional 5.3% |
| Peruvians | 98.5 /100 | #104 | Exceptional 5.3% |
| Immigrants | Italy | 98.4 /100 | #105 | Exceptional 5.3% |
| Immigrants | Yemen | 98.2 /100 | #106 | Exceptional 5.3% |
| Russians | 98.2 /100 | #107 | Exceptional 5.3% |
| Immigrants | South Africa | 98.1 /100 | #108 | Exceptional 5.3% |
| Immigrants | Northern Africa | 98.1 /100 | #109 | Exceptional 5.3% |
| Immigrants | Eritrea | 98.0 /100 | #110 | Exceptional 5.3% |
| Ethiopians | 97.9 /100 | #111 | Exceptional 5.3% |
| Immigrants | Latvia | 97.9 /100 | #112 | Exceptional 5.3% |
| Aleuts | 97.8 /100 | #113 | Exceptional 5.3% |
| Immigrants | Northern Europe | 97.8 /100 | #114 | Exceptional 5.3% |
| Cubans | 97.8 /100 | #115 | Exceptional 5.3% |
| Cypriots | 97.7 /100 | #116 | Exceptional 5.3% |
| Immigrants | Afghanistan | 97.4 /100 | #117 | Exceptional 5.3% |