Immigrants from Jamaica vs Native/Alaskan Unemployment Among Ages 45 to 54 years
COMPARE
Immigrants from Jamaica
Native/Alaskan
Unemployment Among Ages 45 to 54 years
Unemployment Among Ages 45 to 54 years Comparison
Immigrants from Jamaica
Natives/Alaskans
5.4%
UNEMPLOYMENT AMONG AGES 45 TO 54 YEARS
0.0/ 100
METRIC RATING
304th/ 347
METRIC RANK
6.1%
UNEMPLOYMENT AMONG AGES 45 TO 54 YEARS
0.0/ 100
METRIC RATING
324th/ 347
METRIC RANK
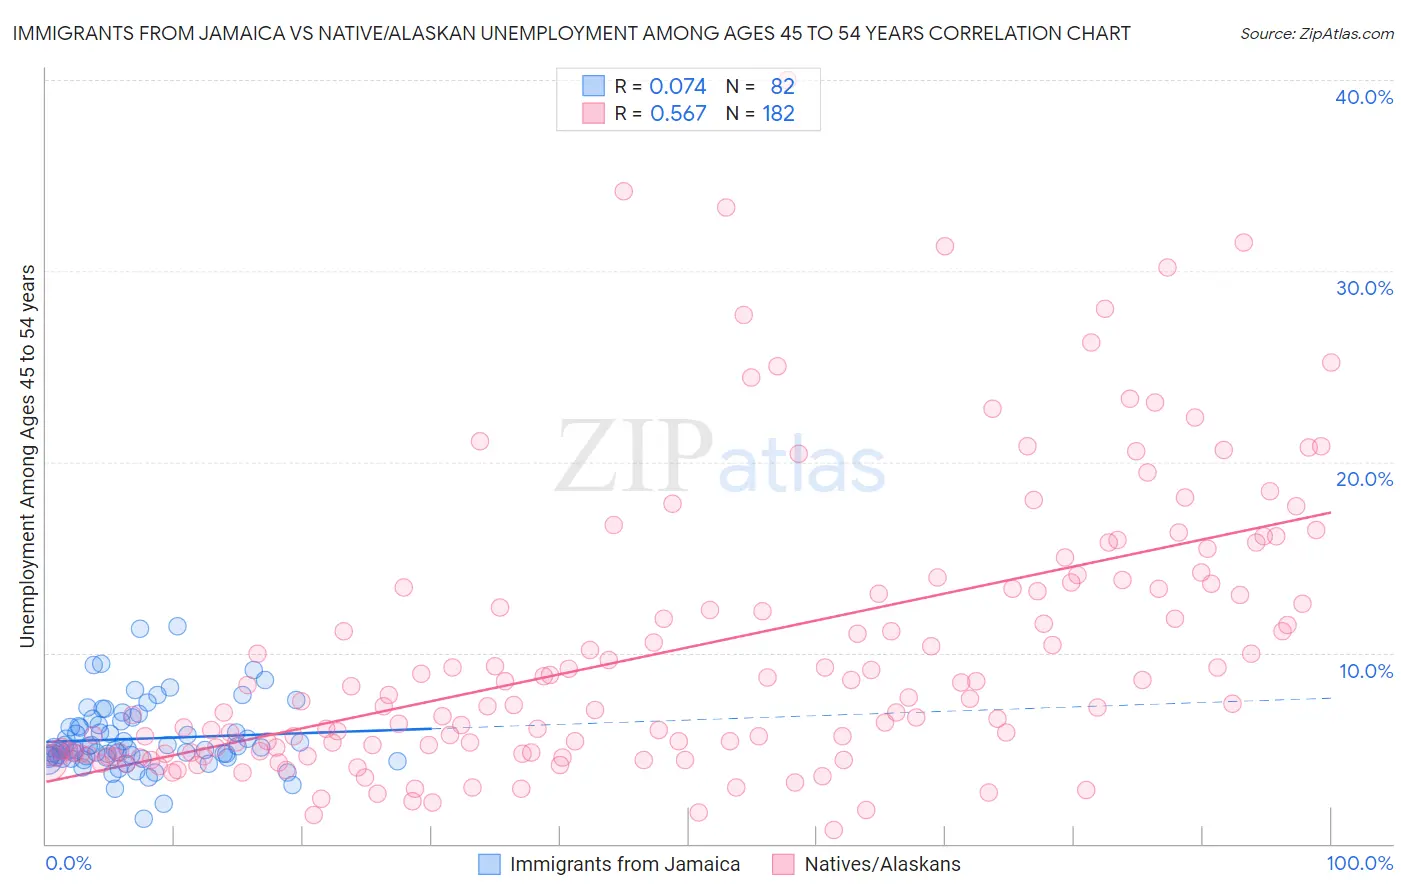
Immigrants from Jamaica vs Native/Alaskan Unemployment Among Ages 45 to 54 years Correlation Chart
The statistical analysis conducted on geographies consisting of 296,481,042 people shows a slight positive correlation between the proportion of Immigrants from Jamaica and unemployment rate among population between the ages 45 and 54 in the United States with a correlation coefficient (R) of 0.074 and weighted average of 5.4%. Similarly, the statistical analysis conducted on geographies consisting of 487,520,360 people shows a substantial positive correlation between the proportion of Natives/Alaskans and unemployment rate among population between the ages 45 and 54 in the United States with a correlation coefficient (R) of 0.567 and weighted average of 6.1%, a difference of 13.1%.
Unemployment Among Ages 45 to 54 years Correlation Summary
| Measurement | Immigrants from Jamaica | Native/Alaskan |
| Minimum | 1.3% | 0.71% |
| Maximum | 11.4% | 40.0% |
| Range | 10.1% | 39.3% |
| Mean | 5.5% | 10.2% |
| Median | 4.9% | 7.4% |
| Interquartile 25% (IQ1) | 4.5% | 4.8% |
| Interquartile 75% (IQ3) | 6.2% | 13.4% |
| Interquartile Range (IQR) | 1.7% | 8.7% |
| Standard Deviation (Sample) | 1.8% | 7.5% |
| Standard Deviation (Population) | 1.8% | 7.4% |
Demographics Similar to Immigrants from Jamaica and Natives/Alaskans by Unemployment Among Ages 45 to 54 years
In terms of unemployment among ages 45 to 54 years, the demographic groups most similar to Immigrants from Jamaica are Immigrants from West Indies (5.4%, a difference of 0.17%), Immigrants from Bangladesh (5.4%, a difference of 0.33%), Vietnamese (5.4%, a difference of 0.59%), Black/African American (5.4%, a difference of 1.3%), and Barbadian (5.5%, a difference of 2.0%). Similarly, the demographic groups most similar to Natives/Alaskans are Immigrants from Cabo Verde (5.9%, a difference of 2.3%), Immigrants from the Azores (5.7%, a difference of 5.3%), Yakama (5.7%, a difference of 5.9%), Immigrants from St. Vincent and the Grenadines (5.7%, a difference of 6.2%), and Cape Verdean (5.7%, a difference of 6.2%).
| Demographics | Rating | Rank | Unemployment Among Ages 45 to 54 years |
| Immigrants | Jamaica | 0.0 /100 | #304 | Tragic 5.4% |
| Immigrants | West Indies | 0.0 /100 | #305 | Tragic 5.4% |
| Immigrants | Bangladesh | 0.0 /100 | #306 | Tragic 5.4% |
| Vietnamese | 0.0 /100 | #307 | Tragic 5.4% |
| Blacks/African Americans | 0.0 /100 | #308 | Tragic 5.4% |
| Barbadians | 0.0 /100 | #309 | Tragic 5.5% |
| Immigrants | Barbados | 0.0 /100 | #310 | Tragic 5.5% |
| Chippewa | 0.0 /100 | #311 | Tragic 5.5% |
| Immigrants | Grenada | 0.0 /100 | #312 | Tragic 5.6% |
| Shoshone | 0.0 /100 | #313 | Tragic 5.6% |
| Guyanese | 0.0 /100 | #314 | Tragic 5.6% |
| Immigrants | Dominica | 0.0 /100 | #315 | Tragic 5.6% |
| Immigrants | Guyana | 0.0 /100 | #316 | Tragic 5.6% |
| Houma | 0.0 /100 | #317 | Tragic 5.6% |
| British West Indians | 0.0 /100 | #318 | Tragic 5.7% |
| Cape Verdeans | 0.0 /100 | #319 | Tragic 5.7% |
| Immigrants | St. Vincent and the Grenadines | 0.0 /100 | #320 | Tragic 5.7% |
| Yakama | 0.0 /100 | #321 | Tragic 5.7% |
| Immigrants | Azores | 0.0 /100 | #322 | Tragic 5.7% |
| Immigrants | Cabo Verde | 0.0 /100 | #323 | Tragic 5.9% |
| Natives/Alaskans | 0.0 /100 | #324 | Tragic 6.1% |