Immigrants from Jamaica vs Native/Alaskan Family Households
COMPARE
Immigrants from Jamaica
Native/Alaskan
Family Households
Family Households Comparison
Immigrants from Jamaica
Natives/Alaskans
64.7%
FAMILY HOUSEHOLDS
85.3/ 100
METRIC RATING
139th/ 347
METRIC RANK
66.4%
FAMILY HOUSEHOLDS
100.0/ 100
METRIC RATING
51st/ 347
METRIC RANK
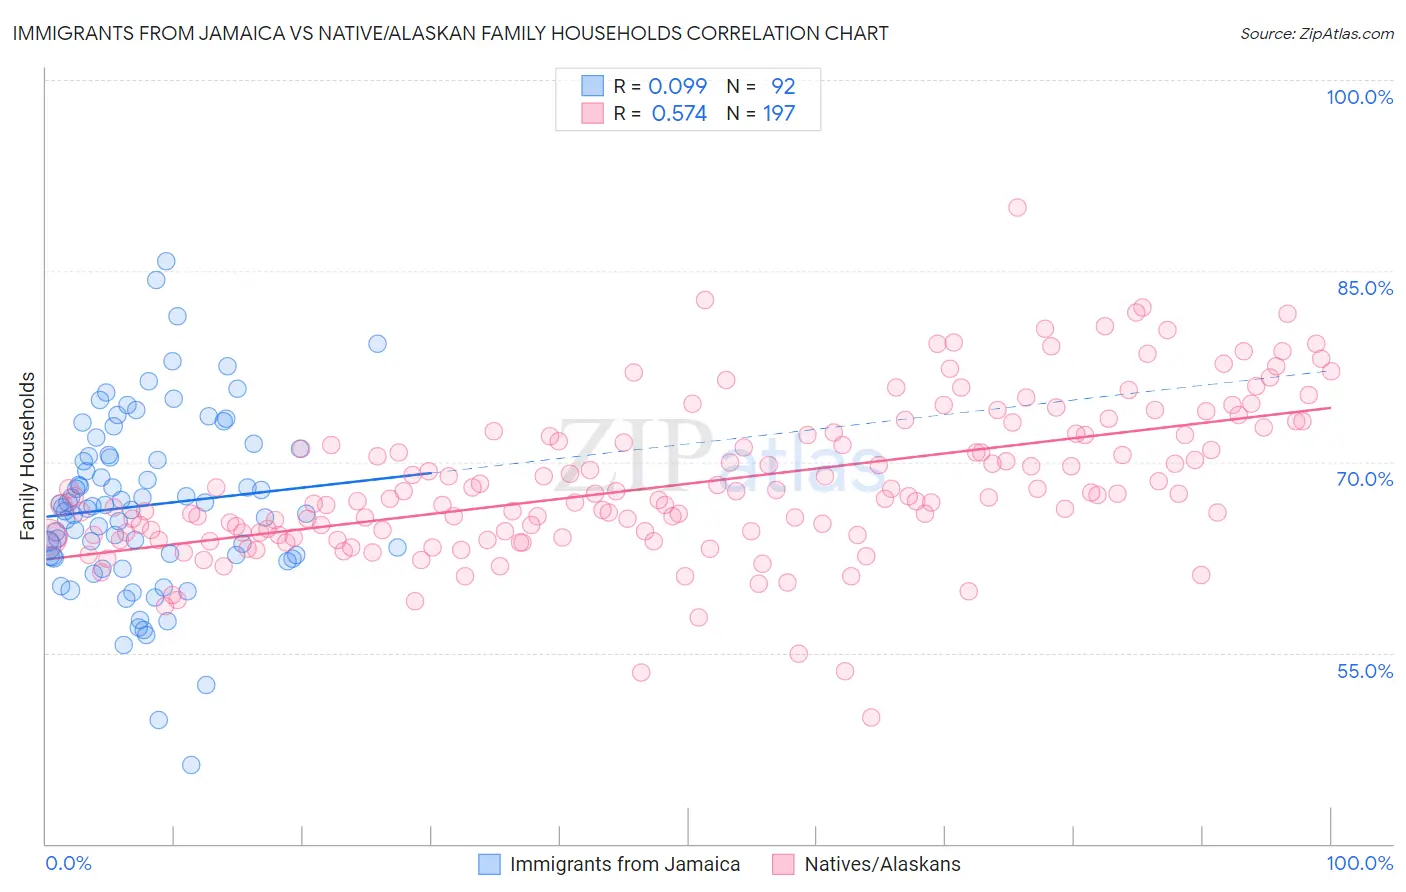
Immigrants from Jamaica vs Native/Alaskan Family Households Correlation Chart
The statistical analysis conducted on geographies consisting of 301,592,909 people shows a slight positive correlation between the proportion of Immigrants from Jamaica and percentage of family households in the United States with a correlation coefficient (R) of 0.099 and weighted average of 64.7%. Similarly, the statistical analysis conducted on geographies consisting of 512,654,863 people shows a substantial positive correlation between the proportion of Natives/Alaskans and percentage of family households in the United States with a correlation coefficient (R) of 0.574 and weighted average of 66.4%, a difference of 2.6%.
Family Households Correlation Summary
| Measurement | Immigrants from Jamaica | Native/Alaskan |
| Minimum | 46.2% | 49.9% |
| Maximum | 85.7% | 90.0% |
| Range | 39.5% | 40.1% |
| Mean | 66.6% | 68.3% |
| Median | 66.4% | 67.2% |
| Interquartile 25% (IQ1) | 62.6% | 64.2% |
| Interquartile 75% (IQ3) | 70.5% | 72.1% |
| Interquartile Range (IQR) | 7.9% | 7.9% |
| Standard Deviation (Sample) | 6.9% | 6.0% |
| Standard Deviation (Population) | 6.9% | 6.0% |
Similar Demographics by Family Households
Demographics Similar to Immigrants from Jamaica by Family Households
In terms of family households, the demographic groups most similar to Immigrants from Jamaica are Basque (64.7%, a difference of 0.010%), Immigrants from North Macedonia (64.7%, a difference of 0.010%), Immigrants from Cameroon (64.7%, a difference of 0.010%), Immigrants from China (64.7%, a difference of 0.030%), and Immigrants from Scotland (64.7%, a difference of 0.030%).
| Demographics | Rating | Rank | Family Households |
| Cajuns | 89.4 /100 | #132 | Excellent 64.8% |
| Belizeans | 89.3 /100 | #133 | Excellent 64.8% |
| Greeks | 88.1 /100 | #134 | Excellent 64.7% |
| Maltese | 87.4 /100 | #135 | Excellent 64.7% |
| Immigrants | China | 86.6 /100 | #136 | Excellent 64.7% |
| Immigrants | Scotland | 86.4 /100 | #137 | Excellent 64.7% |
| Basques | 85.5 /100 | #138 | Excellent 64.7% |
| Immigrants | Jamaica | 85.3 /100 | #139 | Excellent 64.7% |
| Immigrants | North Macedonia | 84.9 /100 | #140 | Excellent 64.7% |
| Immigrants | Cameroon | 84.8 /100 | #141 | Excellent 64.7% |
| Pakistanis | 84.0 /100 | #142 | Excellent 64.7% |
| Czechoslovakians | 82.1 /100 | #143 | Excellent 64.6% |
| South American Indians | 81.9 /100 | #144 | Excellent 64.6% |
| Welsh | 80.1 /100 | #145 | Excellent 64.6% |
| Immigrants | Romania | 77.0 /100 | #146 | Good 64.6% |
Demographics Similar to Natives/Alaskans by Family Households
In terms of family households, the demographic groups most similar to Natives/Alaskans are Navajo (66.4%, a difference of 0.030%), Immigrants from South Central Asia (66.4%, a difference of 0.090%), Immigrants from Venezuela (66.4%, a difference of 0.14%), Colombian (66.3%, a difference of 0.14%), and Afghan (66.3%, a difference of 0.14%).
| Demographics | Rating | Rank | Family Households |
| Asians | 100.0 /100 | #44 | Exceptional 66.5% |
| Venezuelans | 100.0 /100 | #45 | Exceptional 66.5% |
| Arapaho | 100.0 /100 | #46 | Exceptional 66.5% |
| Bolivians | 100.0 /100 | #47 | Exceptional 66.5% |
| Immigrants | Venezuela | 100.0 /100 | #48 | Exceptional 66.4% |
| Immigrants | South Central Asia | 100.0 /100 | #49 | Exceptional 66.4% |
| Navajo | 100.0 /100 | #50 | Exceptional 66.4% |
| Natives/Alaskans | 100.0 /100 | #51 | Exceptional 66.4% |
| Colombians | 100.0 /100 | #52 | Exceptional 66.3% |
| Afghans | 100.0 /100 | #53 | Exceptional 66.3% |
| Immigrants | Colombia | 100.0 /100 | #54 | Exceptional 66.3% |
| Immigrants | Immigrants | 100.0 /100 | #55 | Exceptional 66.1% |
| Immigrants | Hong Kong | 100.0 /100 | #56 | Exceptional 66.1% |
| Pennsylvania Germans | 100.0 /100 | #57 | Exceptional 66.1% |
| Immigrants | Asia | 100.0 /100 | #58 | Exceptional 66.1% |