Albanian vs French Canadian Disability
COMPARE
Albanian
French Canadian
Disability
Disability Comparison
Albanians
French Canadians
11.7%
DISABILITY
50.0/ 100
METRIC RATING
174th/ 347
METRIC RANK
13.4%
DISABILITY
0.0/ 100
METRIC RATING
305th/ 347
METRIC RANK
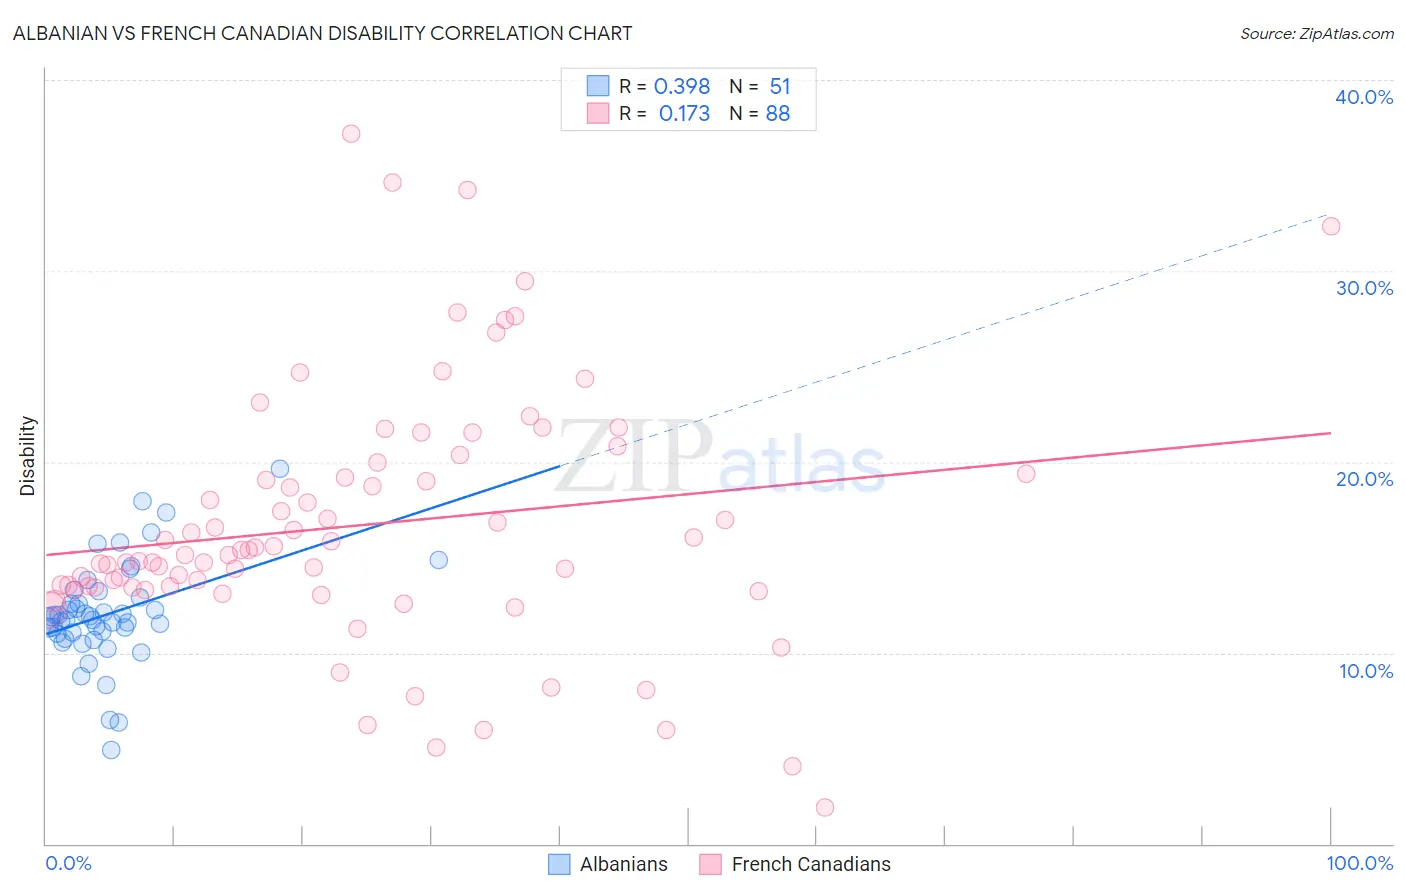
Albanian vs French Canadian Disability Correlation Chart
The statistical analysis conducted on geographies consisting of 193,262,883 people shows a mild positive correlation between the proportion of Albanians and percentage of population with a disability in the United States with a correlation coefficient (R) of 0.398 and weighted average of 11.7%. Similarly, the statistical analysis conducted on geographies consisting of 502,588,623 people shows a poor positive correlation between the proportion of French Canadians and percentage of population with a disability in the United States with a correlation coefficient (R) of 0.173 and weighted average of 13.4%, a difference of 14.7%.
Disability Correlation Summary
| Measurement | Albanian | French Canadian |
| Minimum | 4.9% | 1.9% |
| Maximum | 19.7% | 37.2% |
| Range | 14.8% | 35.3% |
| Mean | 12.0% | 16.7% |
| Median | 11.7% | 15.3% |
| Interquartile 25% (IQ1) | 11.0% | 13.4% |
| Interquartile 75% (IQ3) | 12.9% | 19.7% |
| Interquartile Range (IQR) | 1.9% | 6.3% |
| Standard Deviation (Sample) | 2.7% | 6.7% |
| Standard Deviation (Population) | 2.7% | 6.6% |
Similar Demographics by Disability
Demographics Similar to Albanians by Disability
In terms of disability, the demographic groups most similar to Albanians are Maltese (11.7%, a difference of 0.030%), Haitian (11.7%, a difference of 0.060%), Immigrants from Western Africa (11.7%, a difference of 0.11%), Immigrants from Albania (11.7%, a difference of 0.12%), and Immigrants from Southern Europe (11.7%, a difference of 0.12%).
| Demographics | Rating | Rank | Disability |
| Estonians | 54.4 /100 | #167 | Average 11.7% |
| Immigrants | Latin America | 54.1 /100 | #168 | Average 11.7% |
| Immigrants | Austria | 53.4 /100 | #169 | Average 11.7% |
| Immigrants | Albania | 52.8 /100 | #170 | Average 11.7% |
| Immigrants | Southern Europe | 52.8 /100 | #171 | Average 11.7% |
| Trinidadians and Tobagonians | 52.7 /100 | #172 | Average 11.7% |
| Maltese | 50.6 /100 | #173 | Average 11.7% |
| Albanians | 50.0 /100 | #174 | Average 11.7% |
| Haitians | 48.6 /100 | #175 | Average 11.7% |
| Immigrants | Western Africa | 47.5 /100 | #176 | Average 11.7% |
| Immigrants | Central America | 46.6 /100 | #177 | Average 11.7% |
| Greeks | 46.2 /100 | #178 | Average 11.7% |
| Immigrants | Armenia | 41.9 /100 | #179 | Average 11.7% |
| Immigrants | Honduras | 37.8 /100 | #180 | Fair 11.8% |
| Immigrants | Oceania | 34.3 /100 | #181 | Fair 11.8% |
Demographics Similar to French Canadians by Disability
In terms of disability, the demographic groups most similar to French Canadians are Yakama (13.4%, a difference of 0.35%), Cape Verdean (13.5%, a difference of 0.61%), Shoshone (13.5%, a difference of 0.66%), French American Indian (13.5%, a difference of 0.75%), and Scotch-Irish (13.3%, a difference of 0.81%).
| Demographics | Rating | Rank | Disability |
| Alaska Natives | 0.0 /100 | #298 | Tragic 13.2% |
| French | 0.0 /100 | #299 | Tragic 13.2% |
| Pennsylvania Germans | 0.0 /100 | #300 | Tragic 13.2% |
| Immigrants | Micronesia | 0.0 /100 | #301 | Tragic 13.2% |
| Arapaho | 0.0 /100 | #302 | Tragic 13.2% |
| Scotch-Irish | 0.0 /100 | #303 | Tragic 13.3% |
| Yakama | 0.0 /100 | #304 | Tragic 13.4% |
| French Canadians | 0.0 /100 | #305 | Tragic 13.4% |
| Cape Verdeans | 0.0 /100 | #306 | Tragic 13.5% |
| Shoshone | 0.0 /100 | #307 | Tragic 13.5% |
| French American Indians | 0.0 /100 | #308 | Tragic 13.5% |
| Tlingit-Haida | 0.0 /100 | #309 | Tragic 13.5% |
| Blackfeet | 0.0 /100 | #310 | Tragic 13.6% |
| Delaware | 0.0 /100 | #311 | Tragic 13.6% |
| Spanish Americans | 0.0 /100 | #312 | Tragic 13.6% |