Immigrants from Albania vs French Canadian Disability
COMPARE
Immigrants from Albania
French Canadian
Disability
Disability Comparison
Immigrants from Albania
French Canadians
11.7%
DISABILITY
52.8/ 100
METRIC RATING
170th/ 347
METRIC RANK
13.4%
DISABILITY
0.0/ 100
METRIC RATING
305th/ 347
METRIC RANK
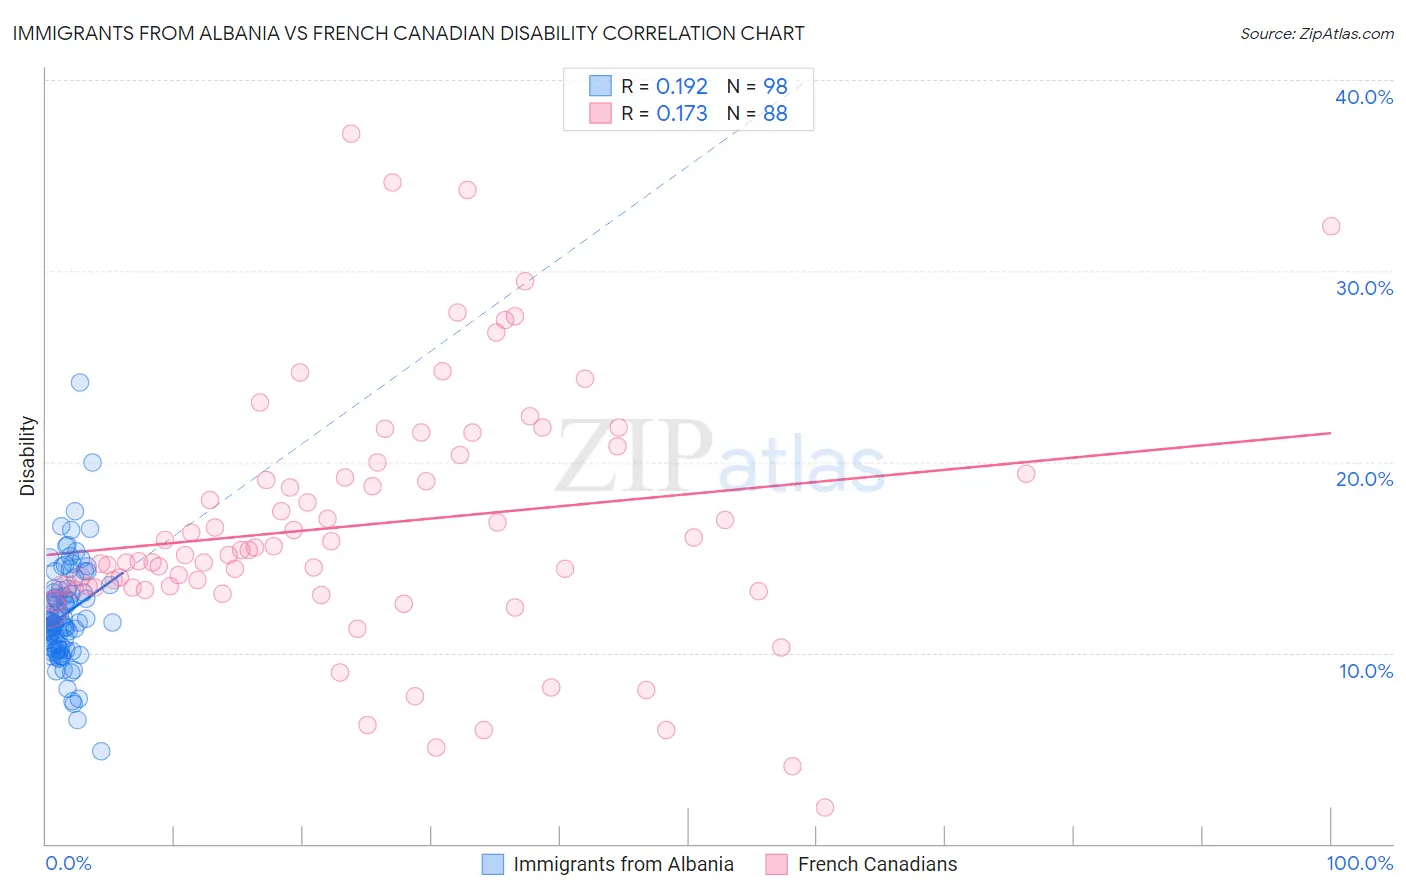
Immigrants from Albania vs French Canadian Disability Correlation Chart
The statistical analysis conducted on geographies consisting of 119,399,287 people shows a poor positive correlation between the proportion of Immigrants from Albania and percentage of population with a disability in the United States with a correlation coefficient (R) of 0.192 and weighted average of 11.7%. Similarly, the statistical analysis conducted on geographies consisting of 502,588,623 people shows a poor positive correlation between the proportion of French Canadians and percentage of population with a disability in the United States with a correlation coefficient (R) of 0.173 and weighted average of 13.4%, a difference of 14.9%.
Disability Correlation Summary
| Measurement | Immigrants from Albania | French Canadian |
| Minimum | 4.8% | 1.9% |
| Maximum | 24.1% | 37.2% |
| Range | 19.3% | 35.3% |
| Mean | 12.0% | 16.7% |
| Median | 11.6% | 15.3% |
| Interquartile 25% (IQ1) | 10.3% | 13.4% |
| Interquartile 75% (IQ3) | 13.3% | 19.7% |
| Interquartile Range (IQR) | 3.0% | 6.3% |
| Standard Deviation (Sample) | 2.7% | 6.7% |
| Standard Deviation (Population) | 2.7% | 6.6% |
Similar Demographics by Disability
Demographics Similar to Immigrants from Albania by Disability
In terms of disability, the demographic groups most similar to Immigrants from Albania are Immigrants from Southern Europe (11.7%, a difference of 0.0%), Trinidadian and Tobagonian (11.7%, a difference of 0.010%), Immigrants from Austria (11.7%, a difference of 0.030%), Immigrants from Latin America (11.7%, a difference of 0.060%), and Estonian (11.7%, a difference of 0.070%).
| Demographics | Rating | Rank | Disability |
| Immigrants | Trinidad and Tobago | 58.9 /100 | #163 | Average 11.7% |
| Syrians | 58.5 /100 | #164 | Average 11.7% |
| Cubans | 56.7 /100 | #165 | Average 11.7% |
| Pakistanis | 54.7 /100 | #166 | Average 11.7% |
| Estonians | 54.4 /100 | #167 | Average 11.7% |
| Immigrants | Latin America | 54.1 /100 | #168 | Average 11.7% |
| Immigrants | Austria | 53.4 /100 | #169 | Average 11.7% |
| Immigrants | Albania | 52.8 /100 | #170 | Average 11.7% |
| Immigrants | Southern Europe | 52.8 /100 | #171 | Average 11.7% |
| Trinidadians and Tobagonians | 52.7 /100 | #172 | Average 11.7% |
| Maltese | 50.6 /100 | #173 | Average 11.7% |
| Albanians | 50.0 /100 | #174 | Average 11.7% |
| Haitians | 48.6 /100 | #175 | Average 11.7% |
| Immigrants | Western Africa | 47.5 /100 | #176 | Average 11.7% |
| Immigrants | Central America | 46.6 /100 | #177 | Average 11.7% |
Demographics Similar to French Canadians by Disability
In terms of disability, the demographic groups most similar to French Canadians are Yakama (13.4%, a difference of 0.35%), Cape Verdean (13.5%, a difference of 0.61%), Shoshone (13.5%, a difference of 0.66%), French American Indian (13.5%, a difference of 0.75%), and Scotch-Irish (13.3%, a difference of 0.81%).
| Demographics | Rating | Rank | Disability |
| Alaska Natives | 0.0 /100 | #298 | Tragic 13.2% |
| French | 0.0 /100 | #299 | Tragic 13.2% |
| Pennsylvania Germans | 0.0 /100 | #300 | Tragic 13.2% |
| Immigrants | Micronesia | 0.0 /100 | #301 | Tragic 13.2% |
| Arapaho | 0.0 /100 | #302 | Tragic 13.2% |
| Scotch-Irish | 0.0 /100 | #303 | Tragic 13.3% |
| Yakama | 0.0 /100 | #304 | Tragic 13.4% |
| French Canadians | 0.0 /100 | #305 | Tragic 13.4% |
| Cape Verdeans | 0.0 /100 | #306 | Tragic 13.5% |
| Shoshone | 0.0 /100 | #307 | Tragic 13.5% |
| French American Indians | 0.0 /100 | #308 | Tragic 13.5% |
| Tlingit-Haida | 0.0 /100 | #309 | Tragic 13.5% |
| Blackfeet | 0.0 /100 | #310 | Tragic 13.6% |
| Delaware | 0.0 /100 | #311 | Tragic 13.6% |
| Spanish Americans | 0.0 /100 | #312 | Tragic 13.6% |