Immigrants from Israel vs Choctaw Disability
COMPARE
Immigrants from Israel
Choctaw
Disability
Disability Comparison
Immigrants from Israel
Choctaw
10.1%
DISABILITY
100.0/ 100
METRIC RATING
12th/ 347
METRIC RANK
15.4%
DISABILITY
0.0/ 100
METRIC RATING
340th/ 347
METRIC RANK
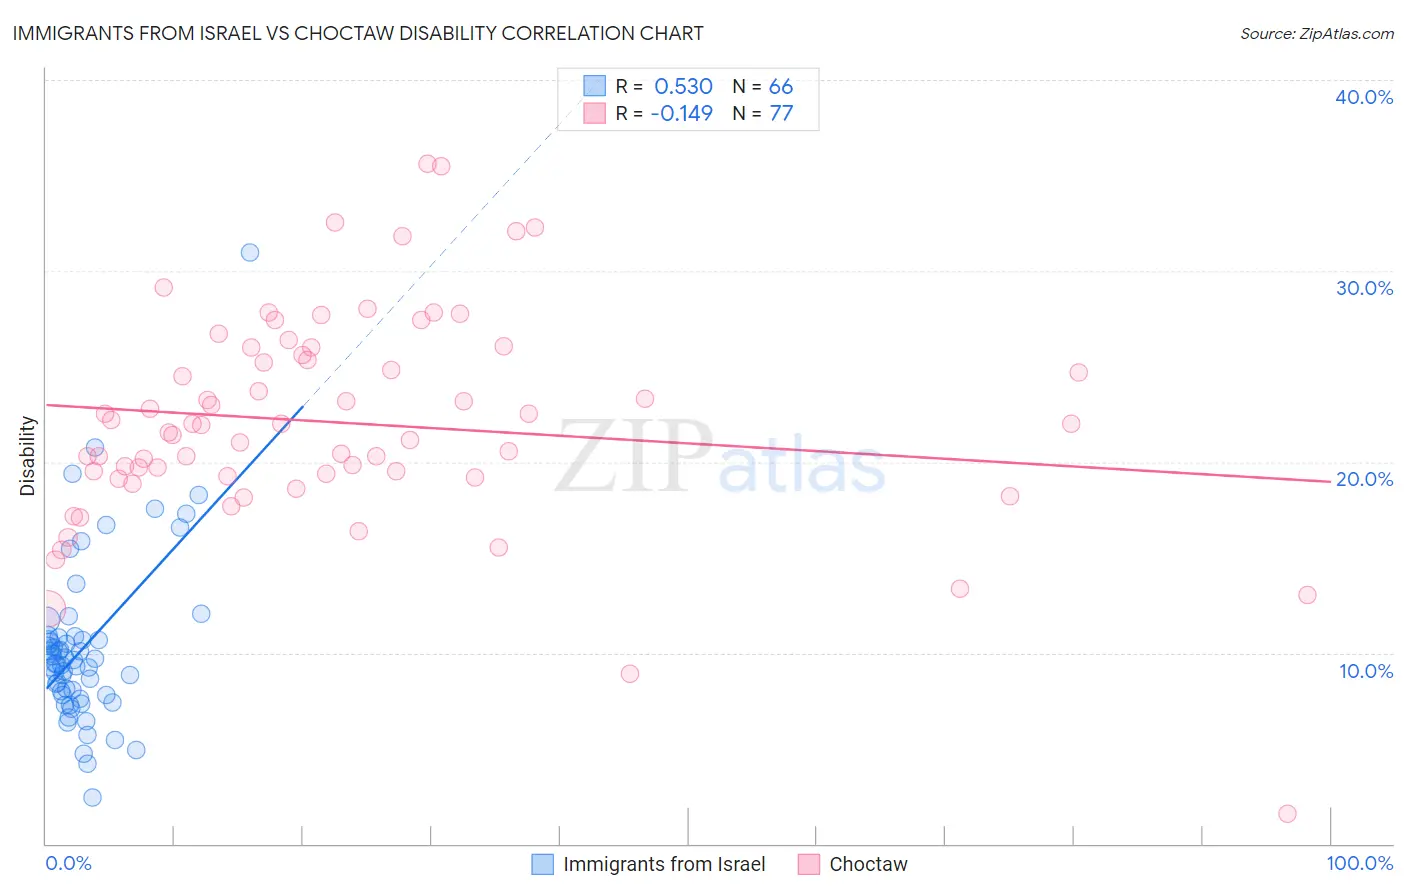
Immigrants from Israel vs Choctaw Disability Correlation Chart
The statistical analysis conducted on geographies consisting of 210,034,302 people shows a substantial positive correlation between the proportion of Immigrants from Israel and percentage of population with a disability in the United States with a correlation coefficient (R) of 0.530 and weighted average of 10.1%. Similarly, the statistical analysis conducted on geographies consisting of 269,676,270 people shows a poor negative correlation between the proportion of Choctaw and percentage of population with a disability in the United States with a correlation coefficient (R) of -0.149 and weighted average of 15.4%, a difference of 51.8%.
Disability Correlation Summary
| Measurement | Immigrants from Israel | Choctaw |
| Minimum | 2.4% | 1.6% |
| Maximum | 31.0% | 35.6% |
| Range | 28.5% | 34.1% |
| Mean | 10.3% | 22.0% |
| Median | 9.5% | 21.9% |
| Interquartile 25% (IQ1) | 7.8% | 19.2% |
| Interquartile 75% (IQ3) | 10.8% | 25.8% |
| Interquartile Range (IQR) | 3.0% | 6.6% |
| Standard Deviation (Sample) | 4.5% | 5.7% |
| Standard Deviation (Population) | 4.4% | 5.7% |
Similar Demographics by Disability
Demographics Similar to Immigrants from Israel by Disability
In terms of disability, the demographic groups most similar to Immigrants from Israel are Immigrants from Eastern Asia (10.2%, a difference of 0.21%), Iranian (10.1%, a difference of 0.25%), Immigrants from China (10.1%, a difference of 0.26%), Immigrants from Korea (10.2%, a difference of 0.81%), and Immigrants from Hong Kong (10.0%, a difference of 1.1%).
| Demographics | Rating | Rank | Disability |
| Immigrants | Bolivia | 100.0 /100 | #5 | Exceptional 9.9% |
| Immigrants | South Central Asia | 100.0 /100 | #6 | Exceptional 9.9% |
| Immigrants | Singapore | 100.0 /100 | #7 | Exceptional 10.0% |
| Bolivians | 100.0 /100 | #8 | Exceptional 10.0% |
| Immigrants | Hong Kong | 100.0 /100 | #9 | Exceptional 10.0% |
| Immigrants | China | 100.0 /100 | #10 | Exceptional 10.1% |
| Iranians | 100.0 /100 | #11 | Exceptional 10.1% |
| Immigrants | Israel | 100.0 /100 | #12 | Exceptional 10.1% |
| Immigrants | Eastern Asia | 100.0 /100 | #13 | Exceptional 10.2% |
| Immigrants | Korea | 100.0 /100 | #14 | Exceptional 10.2% |
| Okinawans | 100.0 /100 | #15 | Exceptional 10.3% |
| Indians (Asian) | 100.0 /100 | #16 | Exceptional 10.3% |
| Immigrants | Iran | 100.0 /100 | #17 | Exceptional 10.3% |
| Burmese | 100.0 /100 | #18 | Exceptional 10.4% |
| Immigrants | Pakistan | 100.0 /100 | #19 | Exceptional 10.4% |
Demographics Similar to Choctaw by Disability
In terms of disability, the demographic groups most similar to Choctaw are Lumbee (15.5%, a difference of 0.84%), Kiowa (15.6%, a difference of 1.3%), Creek (15.6%, a difference of 1.3%), Chickasaw (15.2%, a difference of 1.5%), and Colville (15.8%, a difference of 2.6%).
| Demographics | Rating | Rank | Disability |
| Cajuns | 0.0 /100 | #333 | Tragic 14.6% |
| Yuman | 0.0 /100 | #334 | Tragic 14.6% |
| Tohono O'odham | 0.0 /100 | #335 | Tragic 14.8% |
| Cherokee | 0.0 /100 | #336 | Tragic 14.8% |
| Seminole | 0.0 /100 | #337 | Tragic 14.9% |
| Dutch West Indians | 0.0 /100 | #338 | Tragic 14.9% |
| Chickasaw | 0.0 /100 | #339 | Tragic 15.2% |
| Choctaw | 0.0 /100 | #340 | Tragic 15.4% |
| Lumbee | 0.0 /100 | #341 | Tragic 15.5% |
| Kiowa | 0.0 /100 | #342 | Tragic 15.6% |
| Creek | 0.0 /100 | #343 | Tragic 15.6% |
| Colville | 0.0 /100 | #344 | Tragic 15.8% |
| Puerto Ricans | 0.0 /100 | #345 | Tragic 16.1% |
| Tsimshian | 0.0 /100 | #346 | Tragic 16.1% |
| Houma | 0.0 /100 | #347 | Tragic 17.1% |