Immigrants from Israel vs Immigrants from Armenia Disability
COMPARE
Immigrants from Israel
Immigrants from Armenia
Disability
Disability Comparison
Immigrants from Israel
Immigrants from Armenia
10.1%
DISABILITY
100.0/ 100
METRIC RATING
12th/ 347
METRIC RANK
11.7%
DISABILITY
41.9/ 100
METRIC RATING
179th/ 347
METRIC RANK
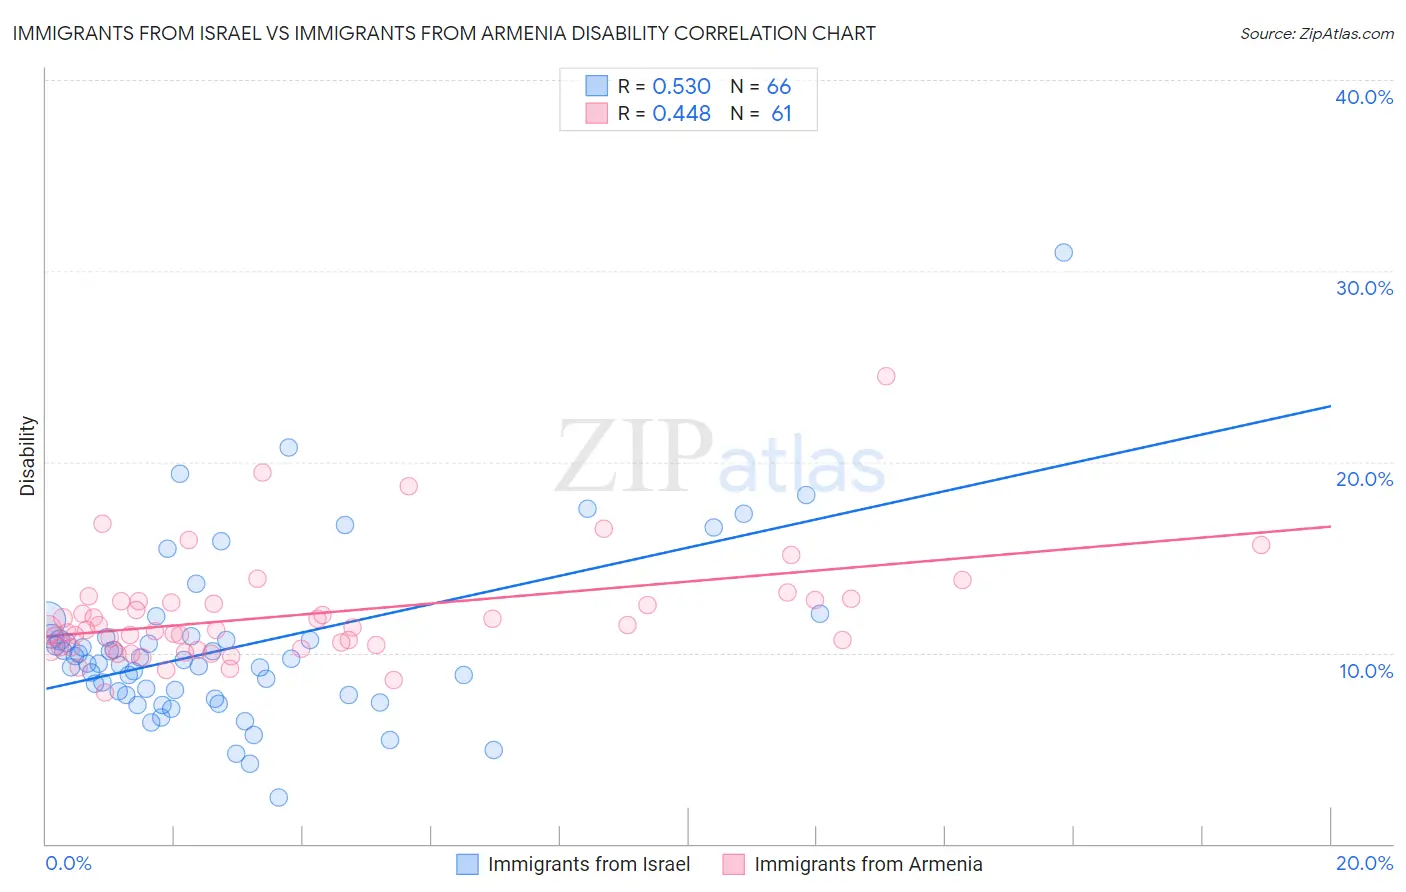
Immigrants from Israel vs Immigrants from Armenia Disability Correlation Chart
The statistical analysis conducted on geographies consisting of 210,034,302 people shows a substantial positive correlation between the proportion of Immigrants from Israel and percentage of population with a disability in the United States with a correlation coefficient (R) of 0.530 and weighted average of 10.1%. Similarly, the statistical analysis conducted on geographies consisting of 97,710,593 people shows a moderate positive correlation between the proportion of Immigrants from Armenia and percentage of population with a disability in the United States with a correlation coefficient (R) of 0.448 and weighted average of 11.7%, a difference of 15.8%.
Disability Correlation Summary
| Measurement | Immigrants from Israel | Immigrants from Armenia |
| Minimum | 2.4% | 7.9% |
| Maximum | 31.0% | 24.5% |
| Range | 28.5% | 16.5% |
| Mean | 10.3% | 12.0% |
| Median | 9.5% | 11.2% |
| Interquartile 25% (IQ1) | 7.8% | 10.3% |
| Interquartile 75% (IQ3) | 10.8% | 12.7% |
| Interquartile Range (IQR) | 3.0% | 2.5% |
| Standard Deviation (Sample) | 4.5% | 2.8% |
| Standard Deviation (Population) | 4.4% | 2.8% |
Similar Demographics by Disability
Demographics Similar to Immigrants from Israel by Disability
In terms of disability, the demographic groups most similar to Immigrants from Israel are Immigrants from Eastern Asia (10.2%, a difference of 0.21%), Iranian (10.1%, a difference of 0.25%), Immigrants from China (10.1%, a difference of 0.26%), Immigrants from Korea (10.2%, a difference of 0.81%), and Immigrants from Hong Kong (10.0%, a difference of 1.1%).
| Demographics | Rating | Rank | Disability |
| Immigrants | Bolivia | 100.0 /100 | #5 | Exceptional 9.9% |
| Immigrants | South Central Asia | 100.0 /100 | #6 | Exceptional 9.9% |
| Immigrants | Singapore | 100.0 /100 | #7 | Exceptional 10.0% |
| Bolivians | 100.0 /100 | #8 | Exceptional 10.0% |
| Immigrants | Hong Kong | 100.0 /100 | #9 | Exceptional 10.0% |
| Immigrants | China | 100.0 /100 | #10 | Exceptional 10.1% |
| Iranians | 100.0 /100 | #11 | Exceptional 10.1% |
| Immigrants | Israel | 100.0 /100 | #12 | Exceptional 10.1% |
| Immigrants | Eastern Asia | 100.0 /100 | #13 | Exceptional 10.2% |
| Immigrants | Korea | 100.0 /100 | #14 | Exceptional 10.2% |
| Okinawans | 100.0 /100 | #15 | Exceptional 10.3% |
| Indians (Asian) | 100.0 /100 | #16 | Exceptional 10.3% |
| Immigrants | Iran | 100.0 /100 | #17 | Exceptional 10.3% |
| Burmese | 100.0 /100 | #18 | Exceptional 10.4% |
| Immigrants | Pakistan | 100.0 /100 | #19 | Exceptional 10.4% |
Demographics Similar to Immigrants from Armenia by Disability
In terms of disability, the demographic groups most similar to Immigrants from Armenia are Greek (11.7%, a difference of 0.19%), Immigrants from Honduras (11.8%, a difference of 0.19%), Immigrants from Central America (11.7%, a difference of 0.21%), Immigrants from Western Africa (11.7%, a difference of 0.25%), and Haitian (11.7%, a difference of 0.30%).
| Demographics | Rating | Rank | Disability |
| Trinidadians and Tobagonians | 52.7 /100 | #172 | Average 11.7% |
| Maltese | 50.6 /100 | #173 | Average 11.7% |
| Albanians | 50.0 /100 | #174 | Average 11.7% |
| Haitians | 48.6 /100 | #175 | Average 11.7% |
| Immigrants | Western Africa | 47.5 /100 | #176 | Average 11.7% |
| Immigrants | Central America | 46.6 /100 | #177 | Average 11.7% |
| Greeks | 46.2 /100 | #178 | Average 11.7% |
| Immigrants | Armenia | 41.9 /100 | #179 | Average 11.7% |
| Immigrants | Honduras | 37.8 /100 | #180 | Fair 11.8% |
| Immigrants | Oceania | 34.3 /100 | #181 | Fair 11.8% |
| Icelanders | 34.0 /100 | #182 | Fair 11.8% |
| Hondurans | 31.2 /100 | #183 | Fair 11.8% |
| Iraqis | 30.0 /100 | #184 | Fair 11.8% |
| Immigrants | Burma/Myanmar | 28.5 /100 | #185 | Fair 11.8% |
| Immigrants | Scotland | 28.2 /100 | #186 | Fair 11.8% |