Immigrants from Israel vs Native/Alaskan Disability
COMPARE
Immigrants from Israel
Native/Alaskan
Disability
Disability Comparison
Immigrants from Israel
Natives/Alaskans
10.1%
DISABILITY
100.0/ 100
METRIC RATING
12th/ 347
METRIC RANK
14.2%
DISABILITY
0.0/ 100
METRIC RATING
325th/ 347
METRIC RANK
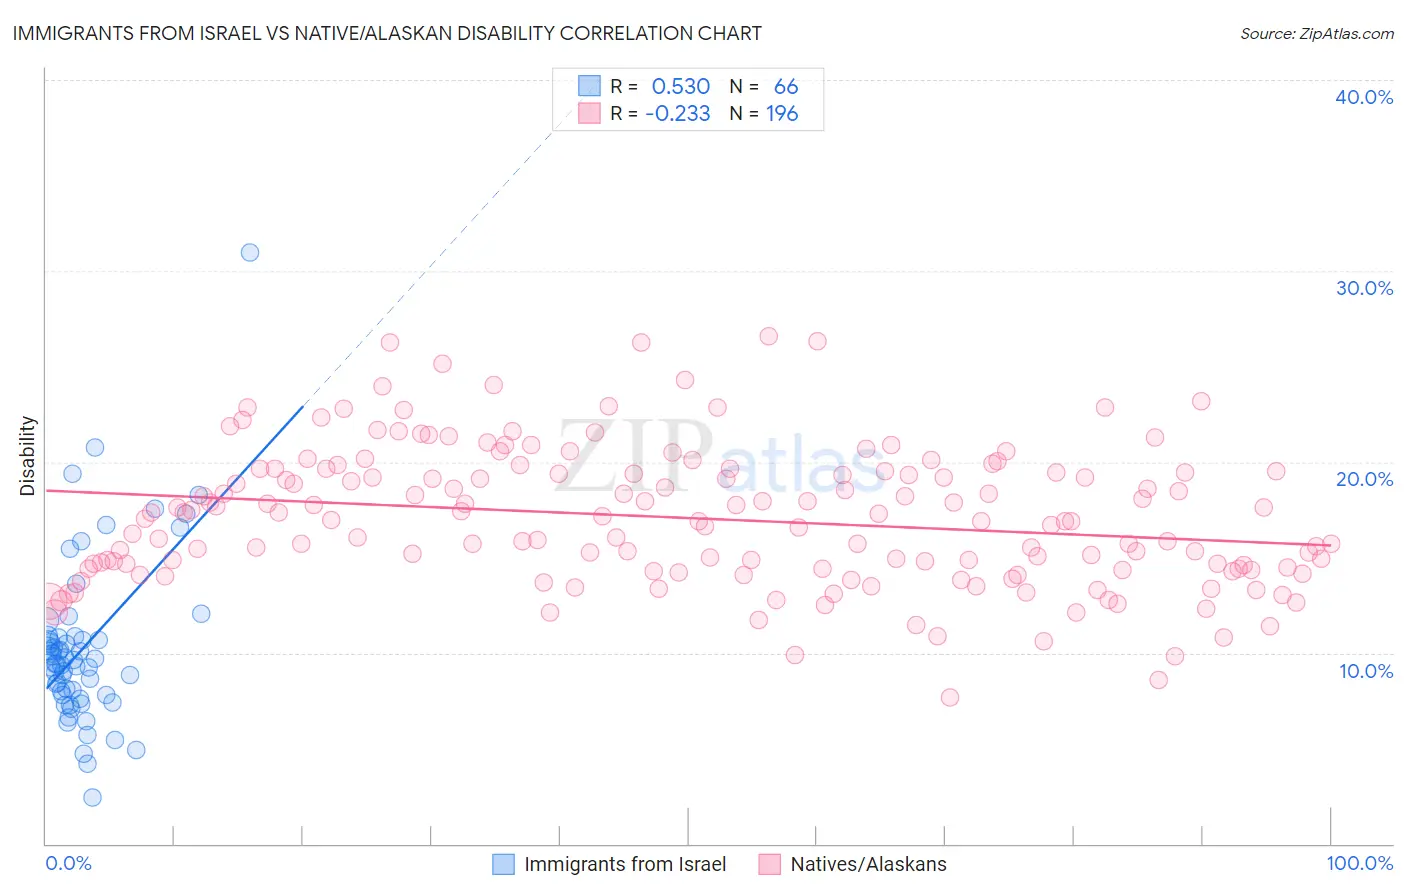
Immigrants from Israel vs Native/Alaskan Disability Correlation Chart
The statistical analysis conducted on geographies consisting of 210,034,302 people shows a substantial positive correlation between the proportion of Immigrants from Israel and percentage of population with a disability in the United States with a correlation coefficient (R) of 0.530 and weighted average of 10.1%. Similarly, the statistical analysis conducted on geographies consisting of 512,916,136 people shows a weak negative correlation between the proportion of Natives/Alaskans and percentage of population with a disability in the United States with a correlation coefficient (R) of -0.233 and weighted average of 14.2%, a difference of 39.6%.
Disability Correlation Summary
| Measurement | Immigrants from Israel | Native/Alaskan |
| Minimum | 2.4% | 7.6% |
| Maximum | 31.0% | 26.5% |
| Range | 28.5% | 18.9% |
| Mean | 10.3% | 17.1% |
| Median | 9.5% | 16.9% |
| Interquartile 25% (IQ1) | 7.8% | 14.4% |
| Interquartile 75% (IQ3) | 10.8% | 19.5% |
| Interquartile Range (IQR) | 3.0% | 5.1% |
| Standard Deviation (Sample) | 4.5% | 3.6% |
| Standard Deviation (Population) | 4.4% | 3.6% |
Similar Demographics by Disability
Demographics Similar to Immigrants from Israel by Disability
In terms of disability, the demographic groups most similar to Immigrants from Israel are Immigrants from Eastern Asia (10.2%, a difference of 0.21%), Iranian (10.1%, a difference of 0.25%), Immigrants from China (10.1%, a difference of 0.26%), Immigrants from Korea (10.2%, a difference of 0.81%), and Immigrants from Hong Kong (10.0%, a difference of 1.1%).
| Demographics | Rating | Rank | Disability |
| Immigrants | Bolivia | 100.0 /100 | #5 | Exceptional 9.9% |
| Immigrants | South Central Asia | 100.0 /100 | #6 | Exceptional 9.9% |
| Immigrants | Singapore | 100.0 /100 | #7 | Exceptional 10.0% |
| Bolivians | 100.0 /100 | #8 | Exceptional 10.0% |
| Immigrants | Hong Kong | 100.0 /100 | #9 | Exceptional 10.0% |
| Immigrants | China | 100.0 /100 | #10 | Exceptional 10.1% |
| Iranians | 100.0 /100 | #11 | Exceptional 10.1% |
| Immigrants | Israel | 100.0 /100 | #12 | Exceptional 10.1% |
| Immigrants | Eastern Asia | 100.0 /100 | #13 | Exceptional 10.2% |
| Immigrants | Korea | 100.0 /100 | #14 | Exceptional 10.2% |
| Okinawans | 100.0 /100 | #15 | Exceptional 10.3% |
| Indians (Asian) | 100.0 /100 | #16 | Exceptional 10.3% |
| Immigrants | Iran | 100.0 /100 | #17 | Exceptional 10.3% |
| Burmese | 100.0 /100 | #18 | Exceptional 10.4% |
| Immigrants | Pakistan | 100.0 /100 | #19 | Exceptional 10.4% |
Demographics Similar to Natives/Alaskans by Disability
In terms of disability, the demographic groups most similar to Natives/Alaskans are Osage (14.2%, a difference of 0.030%), Chippewa (14.1%, a difference of 0.050%), Ottawa (14.2%, a difference of 0.060%), Immigrants from the Azores (14.2%, a difference of 0.060%), and Potawatomi (14.2%, a difference of 0.17%).
| Demographics | Rating | Rank | Disability |
| Menominee | 0.0 /100 | #318 | Tragic 13.8% |
| Iroquois | 0.0 /100 | #319 | Tragic 13.8% |
| Apache | 0.0 /100 | #320 | Tragic 13.9% |
| Paiute | 0.0 /100 | #321 | Tragic 13.9% |
| Americans | 0.0 /100 | #322 | Tragic 13.9% |
| Comanche | 0.0 /100 | #323 | Tragic 14.1% |
| Chippewa | 0.0 /100 | #324 | Tragic 14.1% |
| Natives/Alaskans | 0.0 /100 | #325 | Tragic 14.2% |
| Osage | 0.0 /100 | #326 | Tragic 14.2% |
| Ottawa | 0.0 /100 | #327 | Tragic 14.2% |
| Immigrants | Azores | 0.0 /100 | #328 | Tragic 14.2% |
| Potawatomi | 0.0 /100 | #329 | Tragic 14.2% |
| Navajo | 0.0 /100 | #330 | Tragic 14.3% |
| Alaskan Athabascans | 0.0 /100 | #331 | Tragic 14.4% |
| Pueblo | 0.0 /100 | #332 | Tragic 14.4% |