Immigrants from Israel vs Luxembourger Disability
COMPARE
Immigrants from Israel
Luxembourger
Disability
Disability Comparison
Immigrants from Israel
Luxembourgers
10.1%
DISABILITY
100.0/ 100
METRIC RATING
12th/ 347
METRIC RANK
11.3%
DISABILITY
93.9/ 100
METRIC RATING
117th/ 347
METRIC RANK
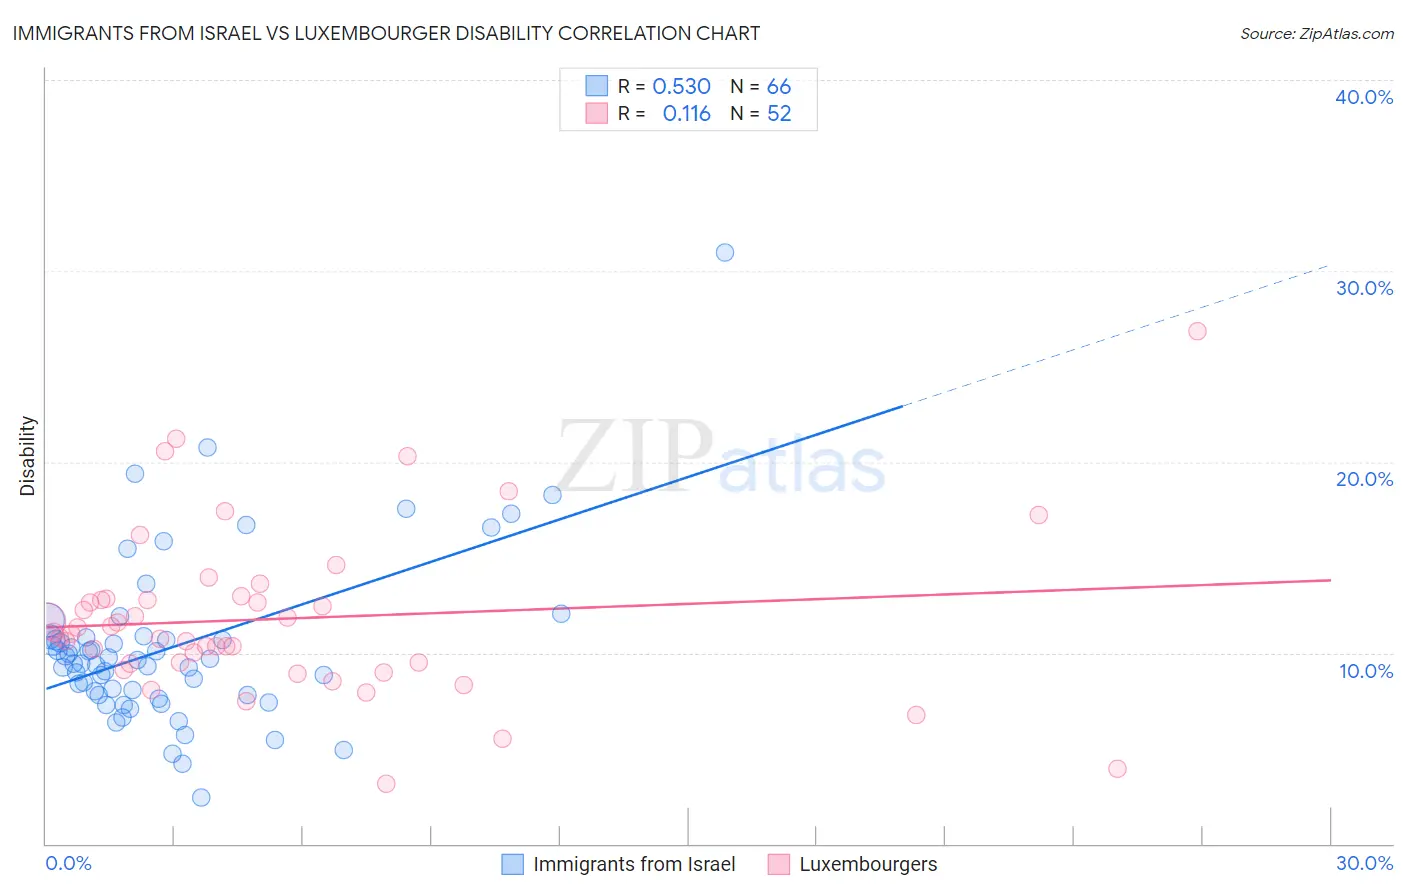
Immigrants from Israel vs Luxembourger Disability Correlation Chart
The statistical analysis conducted on geographies consisting of 210,034,302 people shows a substantial positive correlation between the proportion of Immigrants from Israel and percentage of population with a disability in the United States with a correlation coefficient (R) of 0.530 and weighted average of 10.1%. Similarly, the statistical analysis conducted on geographies consisting of 144,681,066 people shows a poor positive correlation between the proportion of Luxembourgers and percentage of population with a disability in the United States with a correlation coefficient (R) of 0.116 and weighted average of 11.3%, a difference of 11.9%.
Disability Correlation Summary
| Measurement | Immigrants from Israel | Luxembourger |
| Minimum | 2.4% | 3.1% |
| Maximum | 31.0% | 26.9% |
| Range | 28.5% | 23.7% |
| Mean | 10.3% | 11.8% |
| Median | 9.5% | 11.0% |
| Interquartile 25% (IQ1) | 7.8% | 9.5% |
| Interquartile 75% (IQ3) | 10.8% | 12.8% |
| Interquartile Range (IQR) | 3.0% | 3.3% |
| Standard Deviation (Sample) | 4.5% | 4.3% |
| Standard Deviation (Population) | 4.4% | 4.3% |
Similar Demographics by Disability
Demographics Similar to Immigrants from Israel by Disability
In terms of disability, the demographic groups most similar to Immigrants from Israel are Immigrants from Eastern Asia (10.2%, a difference of 0.21%), Iranian (10.1%, a difference of 0.25%), Immigrants from China (10.1%, a difference of 0.26%), Immigrants from Korea (10.2%, a difference of 0.81%), and Immigrants from Hong Kong (10.0%, a difference of 1.1%).
| Demographics | Rating | Rank | Disability |
| Immigrants | Bolivia | 100.0 /100 | #5 | Exceptional 9.9% |
| Immigrants | South Central Asia | 100.0 /100 | #6 | Exceptional 9.9% |
| Immigrants | Singapore | 100.0 /100 | #7 | Exceptional 10.0% |
| Bolivians | 100.0 /100 | #8 | Exceptional 10.0% |
| Immigrants | Hong Kong | 100.0 /100 | #9 | Exceptional 10.0% |
| Immigrants | China | 100.0 /100 | #10 | Exceptional 10.1% |
| Iranians | 100.0 /100 | #11 | Exceptional 10.1% |
| Immigrants | Israel | 100.0 /100 | #12 | Exceptional 10.1% |
| Immigrants | Eastern Asia | 100.0 /100 | #13 | Exceptional 10.2% |
| Immigrants | Korea | 100.0 /100 | #14 | Exceptional 10.2% |
| Okinawans | 100.0 /100 | #15 | Exceptional 10.3% |
| Indians (Asian) | 100.0 /100 | #16 | Exceptional 10.3% |
| Immigrants | Iran | 100.0 /100 | #17 | Exceptional 10.3% |
| Burmese | 100.0 /100 | #18 | Exceptional 10.4% |
| Immigrants | Pakistan | 100.0 /100 | #19 | Exceptional 10.4% |
Demographics Similar to Luxembourgers by Disability
In terms of disability, the demographic groups most similar to Luxembourgers are Korean (11.3%, a difference of 0.010%), Immigrants from Northern Europe (11.3%, a difference of 0.060%), Central American (11.4%, a difference of 0.070%), Immigrants from North Macedonia (11.4%, a difference of 0.070%), and Immigrants from Costa Rica (11.4%, a difference of 0.080%).
| Demographics | Rating | Rank | Disability |
| Immigrants | Denmark | 95.6 /100 | #110 | Exceptional 11.3% |
| Immigrants | South Eastern Asia | 95.4 /100 | #111 | Exceptional 11.3% |
| Immigrants | Uzbekistan | 94.9 /100 | #112 | Exceptional 11.3% |
| Guyanese | 94.7 /100 | #113 | Exceptional 11.3% |
| Immigrants | Syria | 94.7 /100 | #114 | Exceptional 11.3% |
| Immigrants | Philippines | 94.6 /100 | #115 | Exceptional 11.3% |
| Immigrants | Northern Europe | 94.1 /100 | #116 | Exceptional 11.3% |
| Luxembourgers | 93.9 /100 | #117 | Exceptional 11.3% |
| Koreans | 93.8 /100 | #118 | Exceptional 11.3% |
| Central Americans | 93.5 /100 | #119 | Exceptional 11.4% |
| Immigrants | North Macedonia | 93.5 /100 | #120 | Exceptional 11.4% |
| Immigrants | Costa Rica | 93.4 /100 | #121 | Exceptional 11.4% |
| Brazilians | 93.3 /100 | #122 | Exceptional 11.4% |
| South Africans | 92.3 /100 | #123 | Exceptional 11.4% |
| South American Indians | 92.2 /100 | #124 | Exceptional 11.4% |