Immigrants from Israel vs Immigrants from Dominica Disability
COMPARE
Immigrants from Israel
Immigrants from Dominica
Disability
Disability Comparison
Immigrants from Israel
Immigrants from Dominica
10.1%
DISABILITY
100.0/ 100
METRIC RATING
12th/ 347
METRIC RANK
12.4%
DISABILITY
0.6/ 100
METRIC RATING
256th/ 347
METRIC RANK
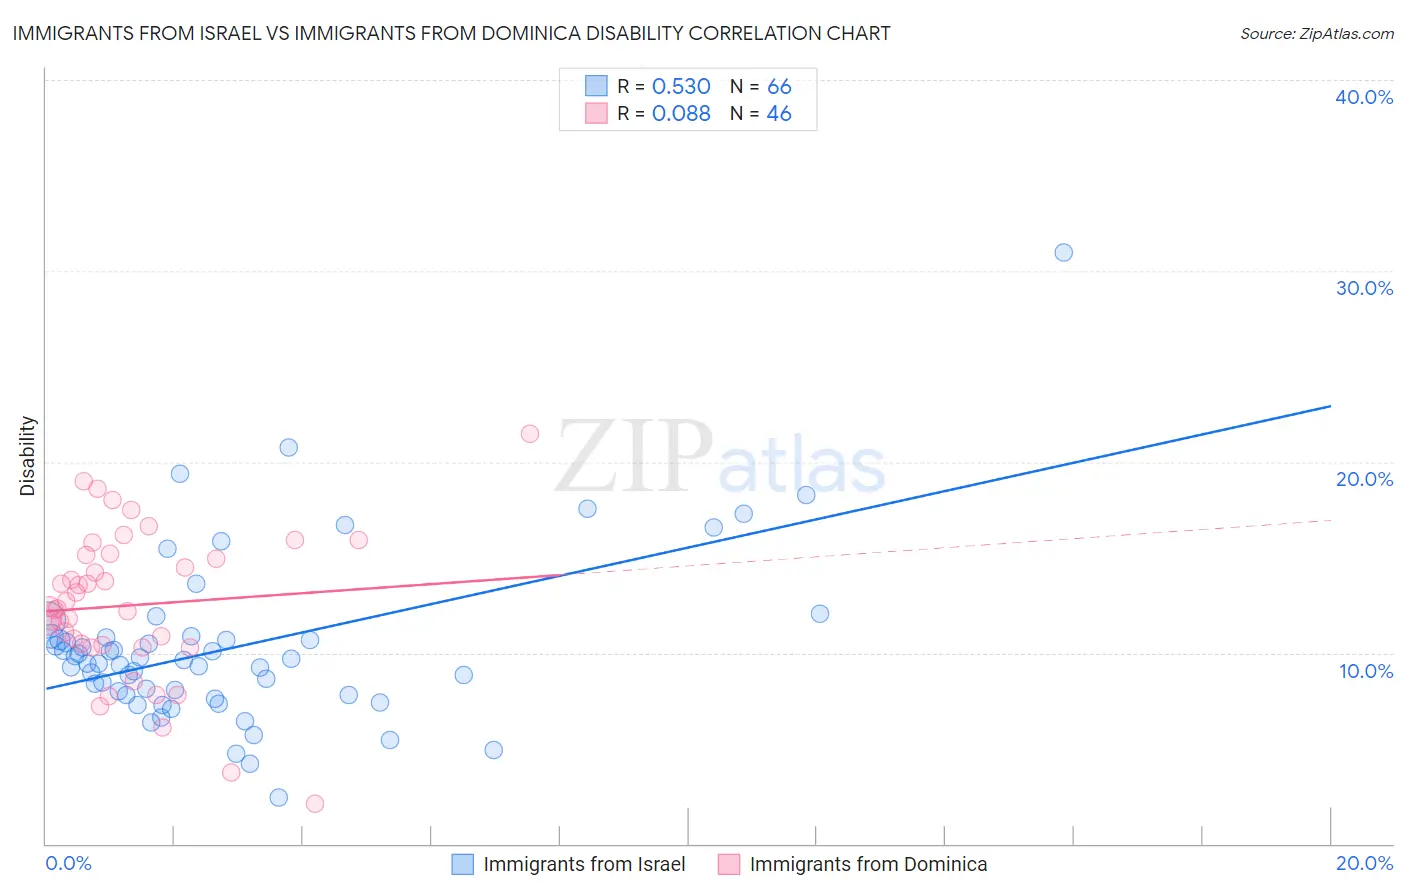
Immigrants from Israel vs Immigrants from Dominica Disability Correlation Chart
The statistical analysis conducted on geographies consisting of 210,034,302 people shows a substantial positive correlation between the proportion of Immigrants from Israel and percentage of population with a disability in the United States with a correlation coefficient (R) of 0.530 and weighted average of 10.1%. Similarly, the statistical analysis conducted on geographies consisting of 83,793,635 people shows a slight positive correlation between the proportion of Immigrants from Dominica and percentage of population with a disability in the United States with a correlation coefficient (R) of 0.088 and weighted average of 12.4%, a difference of 22.0%.
Disability Correlation Summary
| Measurement | Immigrants from Israel | Immigrants from Dominica |
| Minimum | 2.4% | 2.1% |
| Maximum | 31.0% | 21.5% |
| Range | 28.5% | 19.4% |
| Mean | 10.3% | 12.5% |
| Median | 9.5% | 12.4% |
| Interquartile 25% (IQ1) | 7.8% | 10.4% |
| Interquartile 75% (IQ3) | 10.8% | 15.1% |
| Interquartile Range (IQR) | 3.0% | 4.7% |
| Standard Deviation (Sample) | 4.5% | 3.9% |
| Standard Deviation (Population) | 4.4% | 3.9% |
Similar Demographics by Disability
Demographics Similar to Immigrants from Israel by Disability
In terms of disability, the demographic groups most similar to Immigrants from Israel are Immigrants from Eastern Asia (10.2%, a difference of 0.21%), Iranian (10.1%, a difference of 0.25%), Immigrants from China (10.1%, a difference of 0.26%), Immigrants from Korea (10.2%, a difference of 0.81%), and Immigrants from Hong Kong (10.0%, a difference of 1.1%).
| Demographics | Rating | Rank | Disability |
| Immigrants | Bolivia | 100.0 /100 | #5 | Exceptional 9.9% |
| Immigrants | South Central Asia | 100.0 /100 | #6 | Exceptional 9.9% |
| Immigrants | Singapore | 100.0 /100 | #7 | Exceptional 10.0% |
| Bolivians | 100.0 /100 | #8 | Exceptional 10.0% |
| Immigrants | Hong Kong | 100.0 /100 | #9 | Exceptional 10.0% |
| Immigrants | China | 100.0 /100 | #10 | Exceptional 10.1% |
| Iranians | 100.0 /100 | #11 | Exceptional 10.1% |
| Immigrants | Israel | 100.0 /100 | #12 | Exceptional 10.1% |
| Immigrants | Eastern Asia | 100.0 /100 | #13 | Exceptional 10.2% |
| Immigrants | Korea | 100.0 /100 | #14 | Exceptional 10.2% |
| Okinawans | 100.0 /100 | #15 | Exceptional 10.3% |
| Indians (Asian) | 100.0 /100 | #16 | Exceptional 10.3% |
| Immigrants | Iran | 100.0 /100 | #17 | Exceptional 10.3% |
| Burmese | 100.0 /100 | #18 | Exceptional 10.4% |
| Immigrants | Pakistan | 100.0 /100 | #19 | Exceptional 10.4% |
Demographics Similar to Immigrants from Dominica by Disability
In terms of disability, the demographic groups most similar to Immigrants from Dominica are Slovene (12.4%, a difference of 0.070%), Immigrants from Laos (12.4%, a difference of 0.090%), Slavic (12.4%, a difference of 0.23%), Canadian (12.4%, a difference of 0.29%), and Immigrants from Liberia (12.4%, a difference of 0.32%).
| Demographics | Rating | Rank | Disability |
| Carpatho Rusyns | 1.4 /100 | #249 | Tragic 12.3% |
| Sub-Saharan Africans | 1.4 /100 | #250 | Tragic 12.3% |
| Europeans | 1.4 /100 | #251 | Tragic 12.3% |
| Bermudans | 1.1 /100 | #252 | Tragic 12.3% |
| Belgians | 0.8 /100 | #253 | Tragic 12.3% |
| German Russians | 0.8 /100 | #254 | Tragic 12.3% |
| Slovenes | 0.6 /100 | #255 | Tragic 12.4% |
| Immigrants | Dominica | 0.6 /100 | #256 | Tragic 12.4% |
| Immigrants | Laos | 0.5 /100 | #257 | Tragic 12.4% |
| Slavs | 0.5 /100 | #258 | Tragic 12.4% |
| Canadians | 0.4 /100 | #259 | Tragic 12.4% |
| Immigrants | Liberia | 0.4 /100 | #260 | Tragic 12.4% |
| Scandinavians | 0.4 /100 | #261 | Tragic 12.4% |
| Native Hawaiians | 0.3 /100 | #262 | Tragic 12.5% |
| Hawaiians | 0.2 /100 | #263 | Tragic 12.5% |